Generating a Service Graph
This task shows you how to generate a graph of services within an Istio mesh. As part of this task, you will install the Servicegraph addon and use the web-based interface for viewing service graph of the service mesh.
The Bookinfo sample application is used as the example application throughout this task.
Before you begin
- Install Istio in your cluster and deploy an application.
Generating a Service Graph
-
To view a graphical representation of your service mesh, use the Servicegraph add-on which is installed with Istio. Verify that the service is running in your cluster.
In Kubernetes environments, execute the following command:
$ kubectl -n istio-system get svc servicegraph NAME CLUSTER-IP EXTERNAL-IP PORT(S) AGE servicegraph 10.59.253.165 <none> 8088/TCP 30s -
Send traffic to the mesh.
For the Bookinfo sample, visit
http://$GATEWAY_URL/productpagein your web browser or issue the following command:$ curl http://$GATEWAY_URL/productpageRefresh the page a few times (or send the command a few times) to generate a small amount of traffic.
$GATEWAY_URLis the value set in the Bookinfo guide. -
Open the Servicegraph UI.
In Kubernetes environments, execute the following command:
$ kubectl -n istio-system port-forward $(kubectl -n istio-system get pod -l app=servicegraph -o jsonpath='{.items[0].metadata.name}') 8088:8088 &Visit http://localhost:8088/force/forcegraph.html in your web browser. Try clicking on a service to see details on the service. Real time traffic data is shown in a panel below.
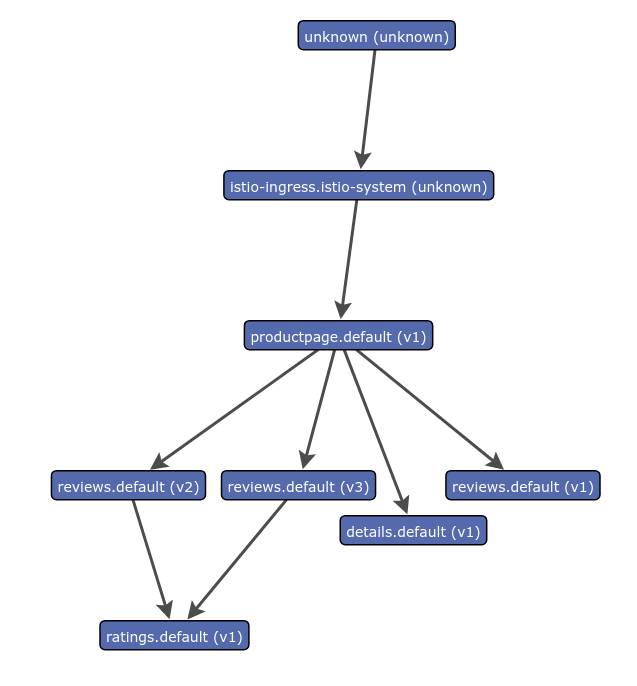
The results will look similar to:
Example Servicegraph -
Experiment with Query Parameters
Visit http://localhost:8088/force/forcegraph.html?time_horizon=15s&filter_empty=true in your web browser. Note the query parameters provided.
filter_empty=truewill only show services that are currently receiving traffic within the time horizon.time_horizon=15saffects the filter above, and also affects the reported traffic information when clicking on a service. The traffic information will be aggregated over the specified time horizon.The default behavior is to not filter empty services, and use a time horizon of 5 minutes.
About the Servicegraph add-on
The Servicegraph service provides endpoints for generating and visualizing a graph of services within a mesh. It exposes the following endpoints:
-
/force/forcegraph.htmlAs explored above, this is an interactive D3.js visualization. -
/dotvizis a static Graphviz visualization. -
/dotgraphprovides a DOT serialization. -
/d3graphprovides a JSON serialization for D3 visualization. -
/graphprovides a generic JSON serialization.
All endpoints take the query parameters explored above.
The Servicegraph example is built on top of Prometheus queries and depends on the standard Istio metric configuration.
Cleanup
-
In Kubernetes environments, execute the following command to remove the Servicegraph add-on:
$ kubectl delete -f @install/kubernetes/addons/servicegraph.yaml@ -
If you are not planning to explore any follow-on tasks, refer to the Bookinfo cleanup instructions to shutdown the application.
