Generating a Service Graph
This task shows you how to generate a graph of services within an Istio mesh. As part of this task, you will install the Servicegraph addon and use the web-based interface for viewing service graph of the service mesh.
The Bookinfo sample application is used as the example application throughout this task.
Before you begin
Install Istio in your cluster and deploy an application.
Install the Prometheus add-on. Directions for install of this add-on are supplied as part of the Querying Metrics Task.
Use of the Prometheus add-on is required for the service graph.
Generating a Service Graph
To view a graphical representation of your service mesh, install the Servicegraph add-on.
In Kubernetes environments, execute the following command:
kubectl apply -f install/kubernetes/addons/servicegraph.yamlVerify that the service is running in your cluster.
In Kubernetes environments, execute the following command:
kubectl -n istio-system get svc servicegraphThe output will be similar to:
NAME           CLUSTER-IP      EXTERNAL-IP   PORT(S)    AGE
servicegraph   10.59.253.165   <none>        8088/TCP   30s
Send traffic to the mesh.
For the Bookinfo sample, visit
http://$GATEWAY_URL/productpagein your web browser or issue the following command:curl http://$GATEWAY_URL/productpageRefresh the page a few times (or send the command a few times) to generate a small amount of traffic.
Note:
$GATEWAY_URLis the value set in the Bookinfo guide.Open the Servicegraph UI.
In Kubernetes environments, execute the following command:
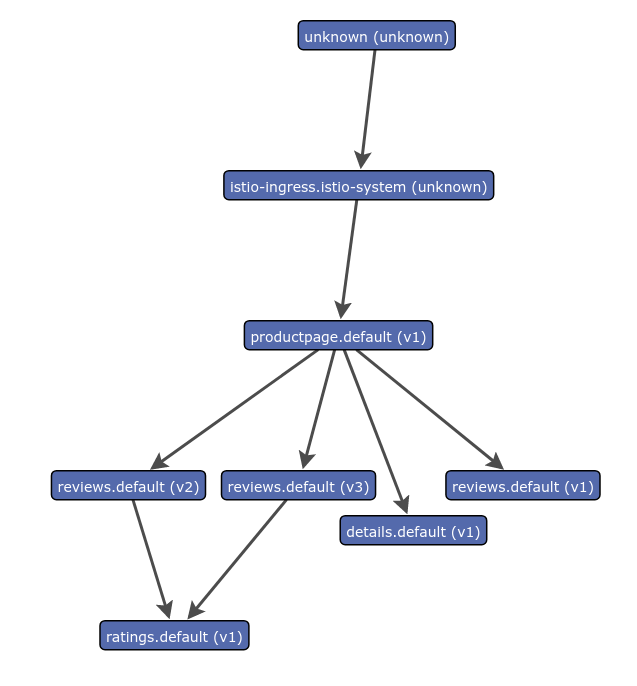
kubectl -n istio-system port-forward $(kubectl -n istio-system get pod -l app=servicegraph -o jsonpath='{.items[0].metadata.name}') 8088:8088 &Visit http://localhost:8088/force/forcegraph.html in your web browser. Try clicking on a service to see details on the service. Real time traffic data is shown in a panel below.
The results will look similar to:
Experiment with Query Parameters
Visit http://localhost:8088/force/forcegraph.html?time_horizon=15s&filter_empty=true in your web browser. Note the query parameters provided.
filter_empty=truewill only show services that are currently receiving traffic within the time horizon.time_horizon=15saffects the filter above, and also affects the reported traffic information when clicking on a service. The traffic information will be aggregated over the specified time horizon.The default behavior is to not filter empty services, and use a time horizon of 5 minutes.
About the Servicegraph Add-on
The Servicegraph service provides endpoints for generating and visualizing a graph of services within a mesh. It exposes the following endpoints:
/force/forcegraph.htmlAs explored above, this is an interactive D3.js visualization./dotvizis a static Graphviz visualization./dotgraphprovides a DOT serialization./d3graphprovides a JSON serialization for D3 visualization./graphprovides a generic JSON serialization.
All endpoints take the query parameters explored above.
The Servicegraph example is built on top of Prometheus queries and depends on the standard Istio metric configuration.
Cleanup
In Kubernetes environments, execute the following command to remove the Servicegraph add-on:
kubectl delete -f install/kubernetes/addons/servicegraph.yamlIf you are not planning to explore any follow-on tasks, refer to the Bookinfo cleanup instructions to shutdown the application.
