Monitoring with Istio
Monitoring is crucial to support transitioning to the microservices architecture style. Other requirements include rapid provisioning and rapid deployment, according to this article.
With Istio, you gain monitoring of the traffic between microservices by default. You can use the Istio Dashboard for monitoring your microservices in real time.
Istio is integrated out-of-the-box with Prometheus time series database and monitoring system. Prometheus collects various traffic-related metrics and provides a rich query language for them.
See below several examples of Prometheus Istio-related queries.
Access the Prometheus UI at http://my-istio-logs-database.io. (The
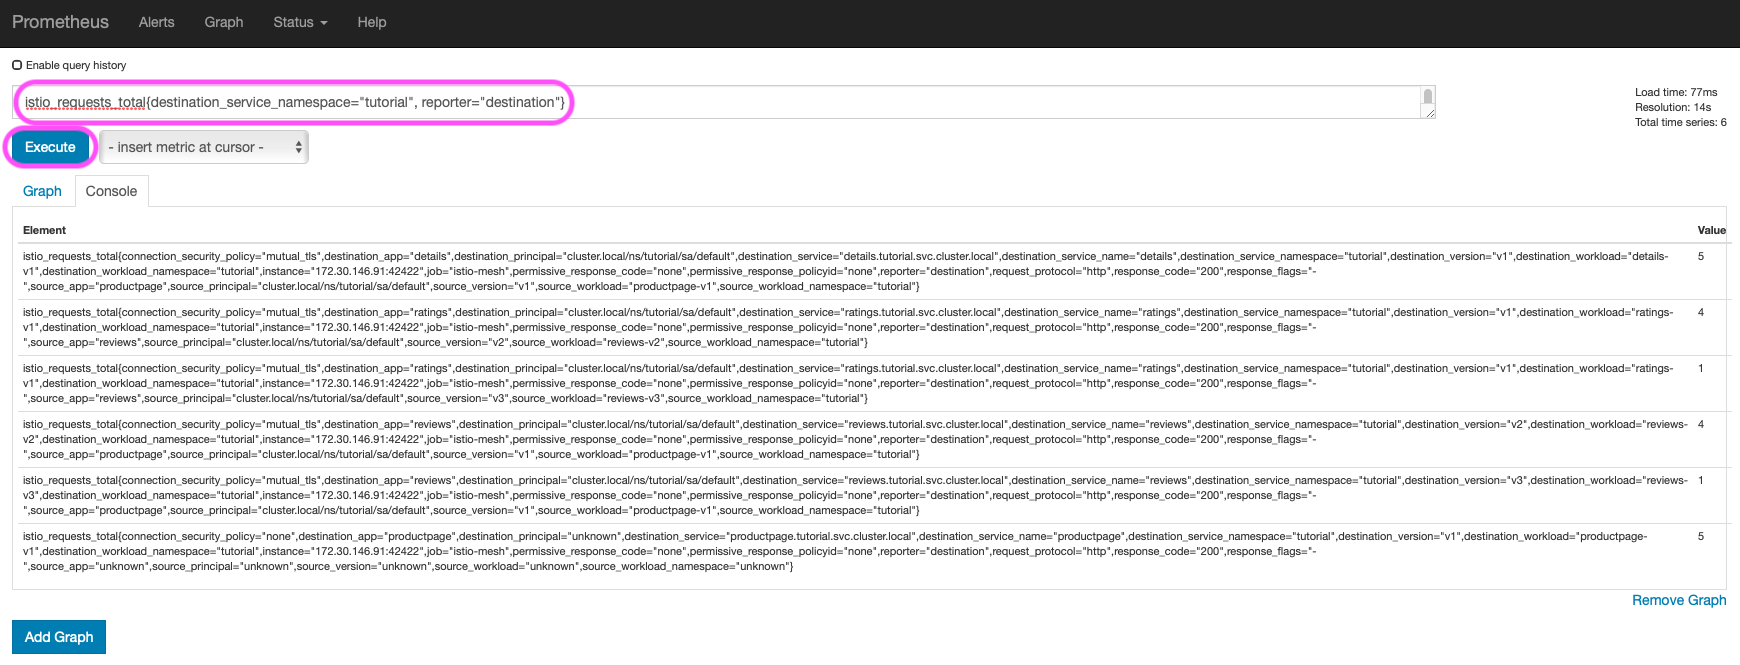
my-istio-logs-database.ioURL should be in your /etc/hosts file, you set it previously).Prometheus Query UI Run the following example queries in the Expression input box. Push the Execute button to see query results in the Console tab. The queries use
tutorialas the name of the application’s namespace, substitute it with the name of your namespace. For best results, run the real-time traffic simulator described in the previous steps when querying data.Get all the requests in your namespace:
istio_requests_total{destination_service_namespace="tutorial", reporter="destination"}Get the sum of all the requests in your namespace:
sum(istio_requests_total{destination_service_namespace="tutorial", reporter="destination"})Get the requests to
reviewsmicroservice:istio_requests_total{destination_service_namespace="tutorial", reporter="destination",destination_service_name="reviews"}Rate of requests over the past 5 minutes to all instances of the
reviewsmicroservice:rate(istio_requests_total{destination_service_namespace="tutorial", reporter="destination",destination_service_name="reviews"}[5m])
The queries above use the istio_requests_total metric, which is a standard Istio metric. You can observe
other metrics, in particular, the ones of Envoy (Envoy is the sidecar proxy of Istio). You
can see the collected metrics in the insert metric at cursor drop-down menu.
Next steps
Congratulations on completing the tutorial!
These tasks are a great place for beginners to further evaluate Istio’s
features using this demo installation:
- Request routing
- Fault injection
- Traffic shifting
- Querying metrics
- Visualizing metrics
- Rate limiting
- Accessing external services
- Visualizing your mesh
Before you customize Istio for production use, see these resources:
Join the Istio community
We welcome you to ask questions and give us feedback by joining the Istio community.
