Lightstep
This task shows you how to configure Istio to collect trace spans and send them to Lightstep. Lightstep lets you analyze 100% of unsampled transaction data from large-scale production software to produce meaningful distributed traces and metrics that help explain performance behaviors and accelerate root cause analysis. At the end of this task, Istio sends trace spans from the proxies to a Lightstep Satellite pool making them available to the web UI.
This task uses the Bookinfo sample application as an example.
Before you begin
Ensure you have a Lightstep account. Sign up for a free trial of Lightstep.
If you’re using on-premise Satellites, ensure you have a satellite pool configured with TLS certs and a secure GRPC port exposed. See Install and Configure Satellites for details about setting up satellites.
For Lightstep Public Satellites or Developer Satellites, your satellites are already configured.
Ensure sure you have a Lightstep access token. Access tokens allow your app to communicate with your Lightstep project.
You’ll need to deploy Istio with your satellite address. For on-premise Satellites, ensure you can reach the satellite pool at an address in the format
<Host>:<Port>, for examplelightstep-satellite.lightstep:9292.For for Public or Developer Satellites, use the address
collector-grpc.lightstep.com:443.Deploy Istio with the following configuration parameters specified:
pilot.traceSampling=100global.proxy.tracer="lightstep"global.tracer.lightstep.address="<satellite-address>"global.tracer.lightstep.accessToken="<access-token>"global.tracer.lightstep.secure=trueglobal.tracer.lightstep.cacertPath="/etc/lightstep/cacert.pem"
You can set these parameters using the
--set key=valuesyntax when you run the install command. For example:$ istioctl install \ --set values.pilot.traceSampling=100 \ --set values.global.proxy.tracer="lightstep" \ --set values.global.tracer.lightstep.address="<satellite-address>" \ --set values.global.tracer.lightstep.accessToken="<access-token>" \ --set values.global.tracer.lightstep.secure=true \ --set values.global.tracer.lightstep.cacertPath="/etc/lightstep/cacert.pem"Store your satellite pool’s certificate authority certificate as a secret in the default namespace. For Lightstep Public and Developer Satellites, download and use this certificate. If you deploy the Bookinfo application in a different namespace, create the secret in that namespace instead.
$ CACERT=$(cat Cert_Auth.crt | base64) # Cert_Auth.crt contains the necessary CACert
$ NAMESPACE=default
$ cat <<EOF | kubectl apply -f - apiVersion: v1 kind: Secret metadata: name: lightstep.cacert namespace: $NAMESPACE labels: app: lightstep type: Opaque data: cacert.pem: $CACERT EOFFollow the instructions to deploy the Bookinfo sample application.
Visualize trace data
Follow the instructions to create an ingress gateway for the Bookinfo application.
To verify the previous step’s success, confirm that you set
GATEWAY_URLenvironment variable in your shell.Send traffic to the sample application.
$ curl http://$GATEWAY_URL/productpageLoad the Lightstep web UI. You’ll see the three Bookinfo services listed in the Service Directory.
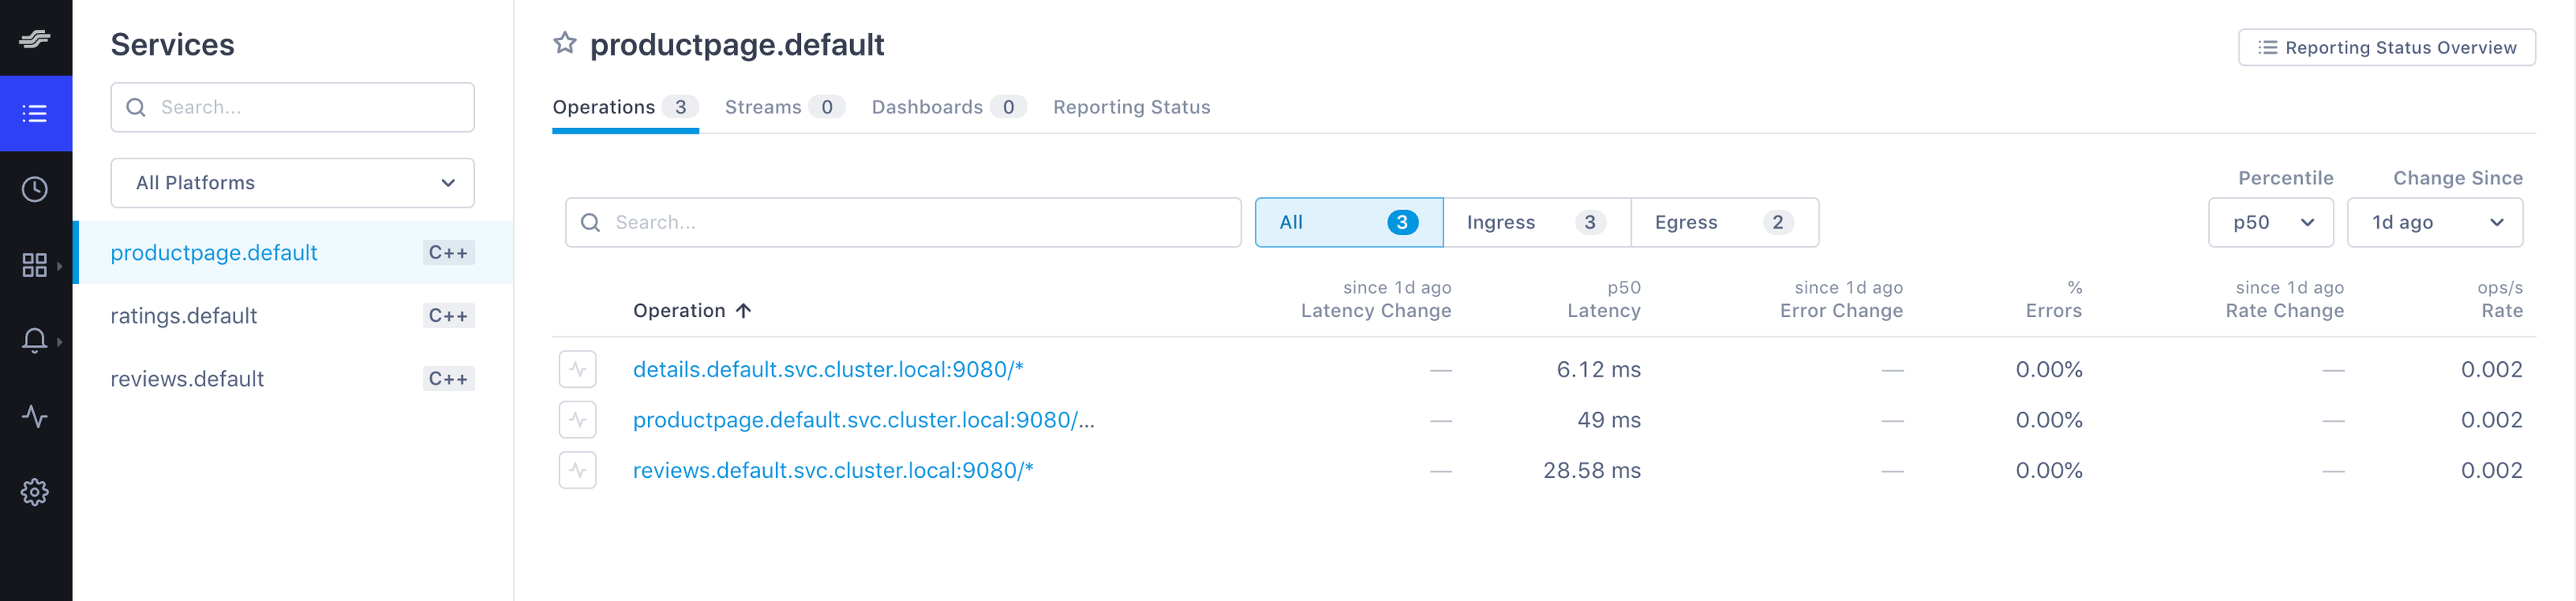
Bookfinder services in the Service Directory Navigate to the Explorer view.
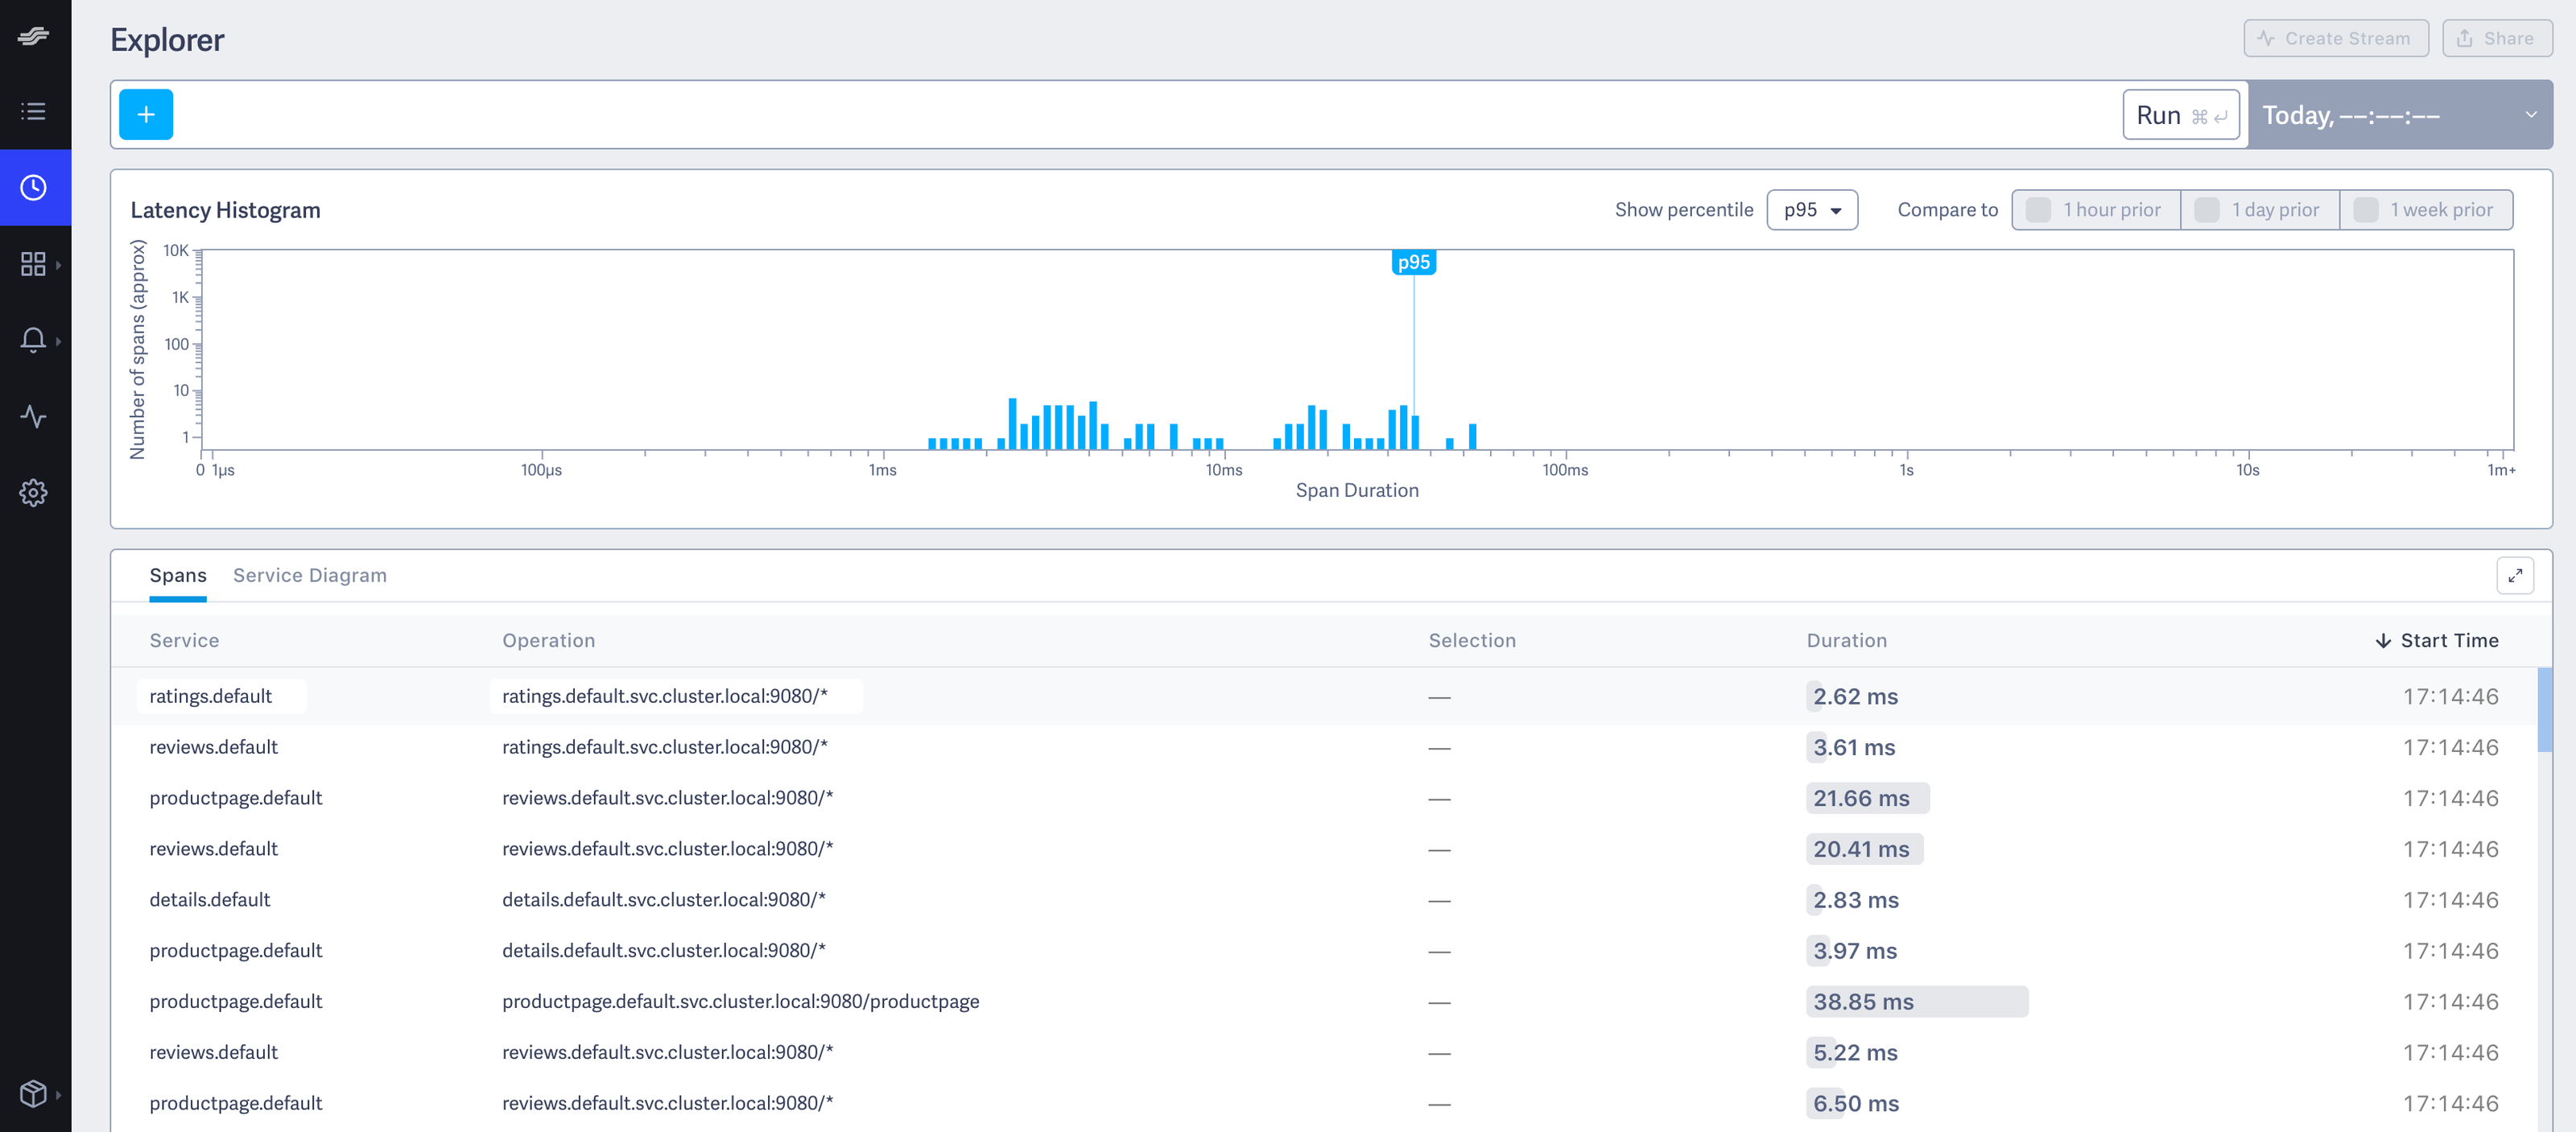
Explorer view Find the query bar at the top. The query bar allows you to interactively filter results by a Service, Operation, and Tag values.
Select
productpage.defaultfrom the Service drop-down list.Click Run. You see something similar to the following:
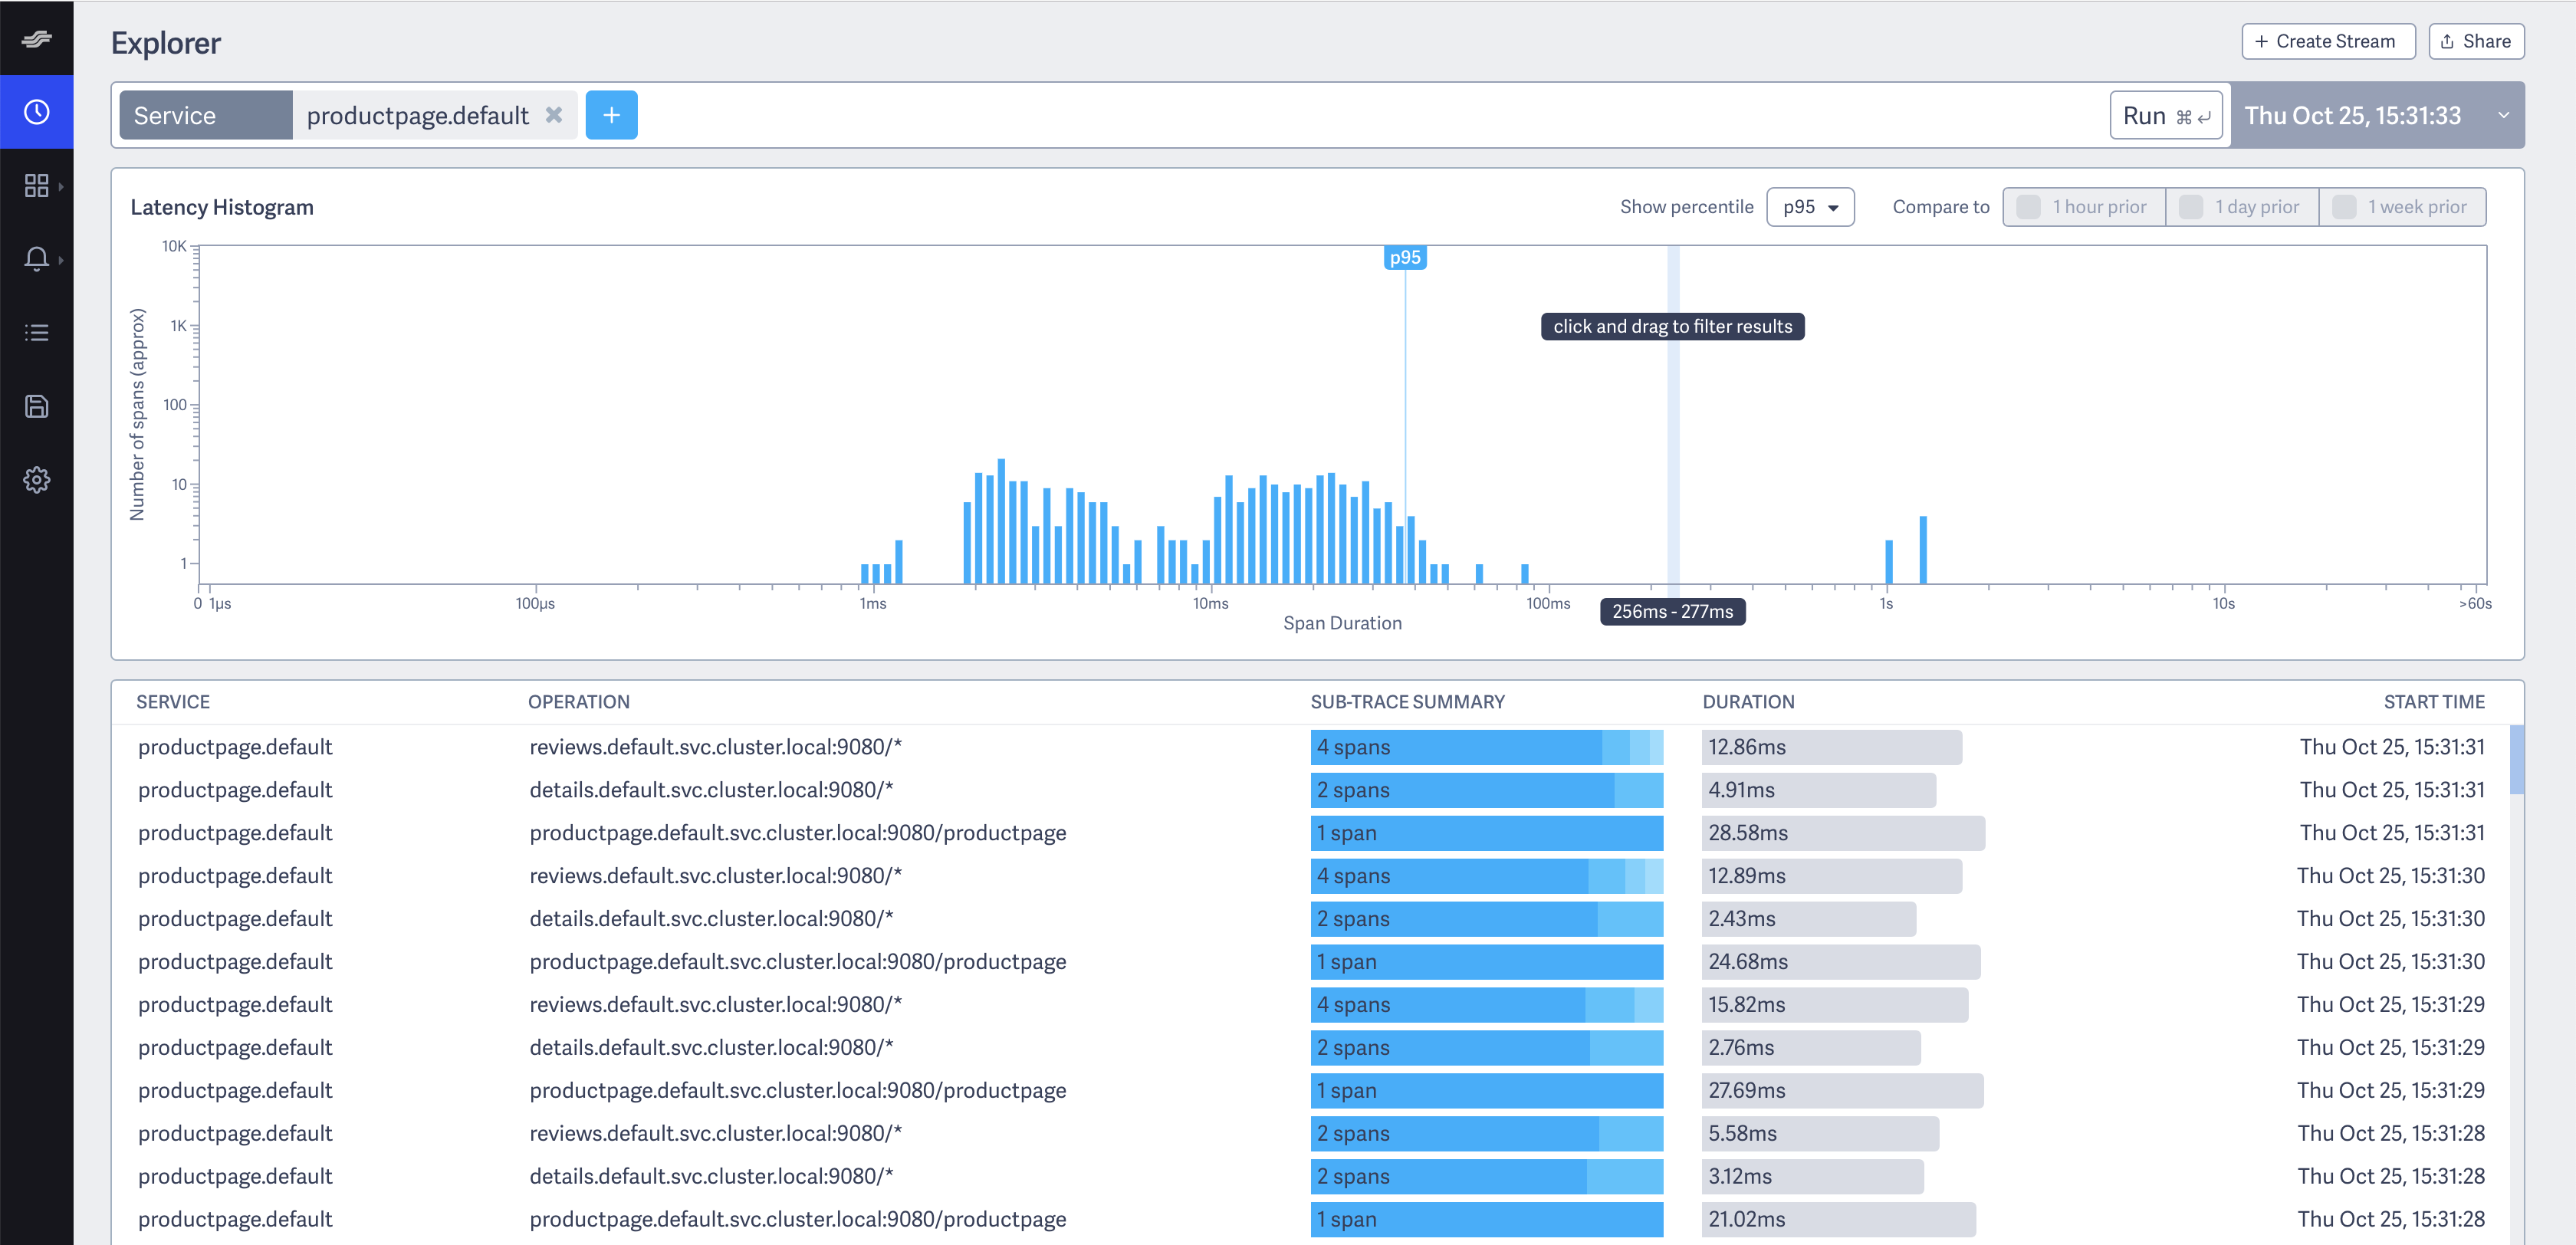
Explorer Click on the first row in the table of example traces below the latency histogram to see the details corresponding to your refresh of the
/productpage. The page then looks similar to: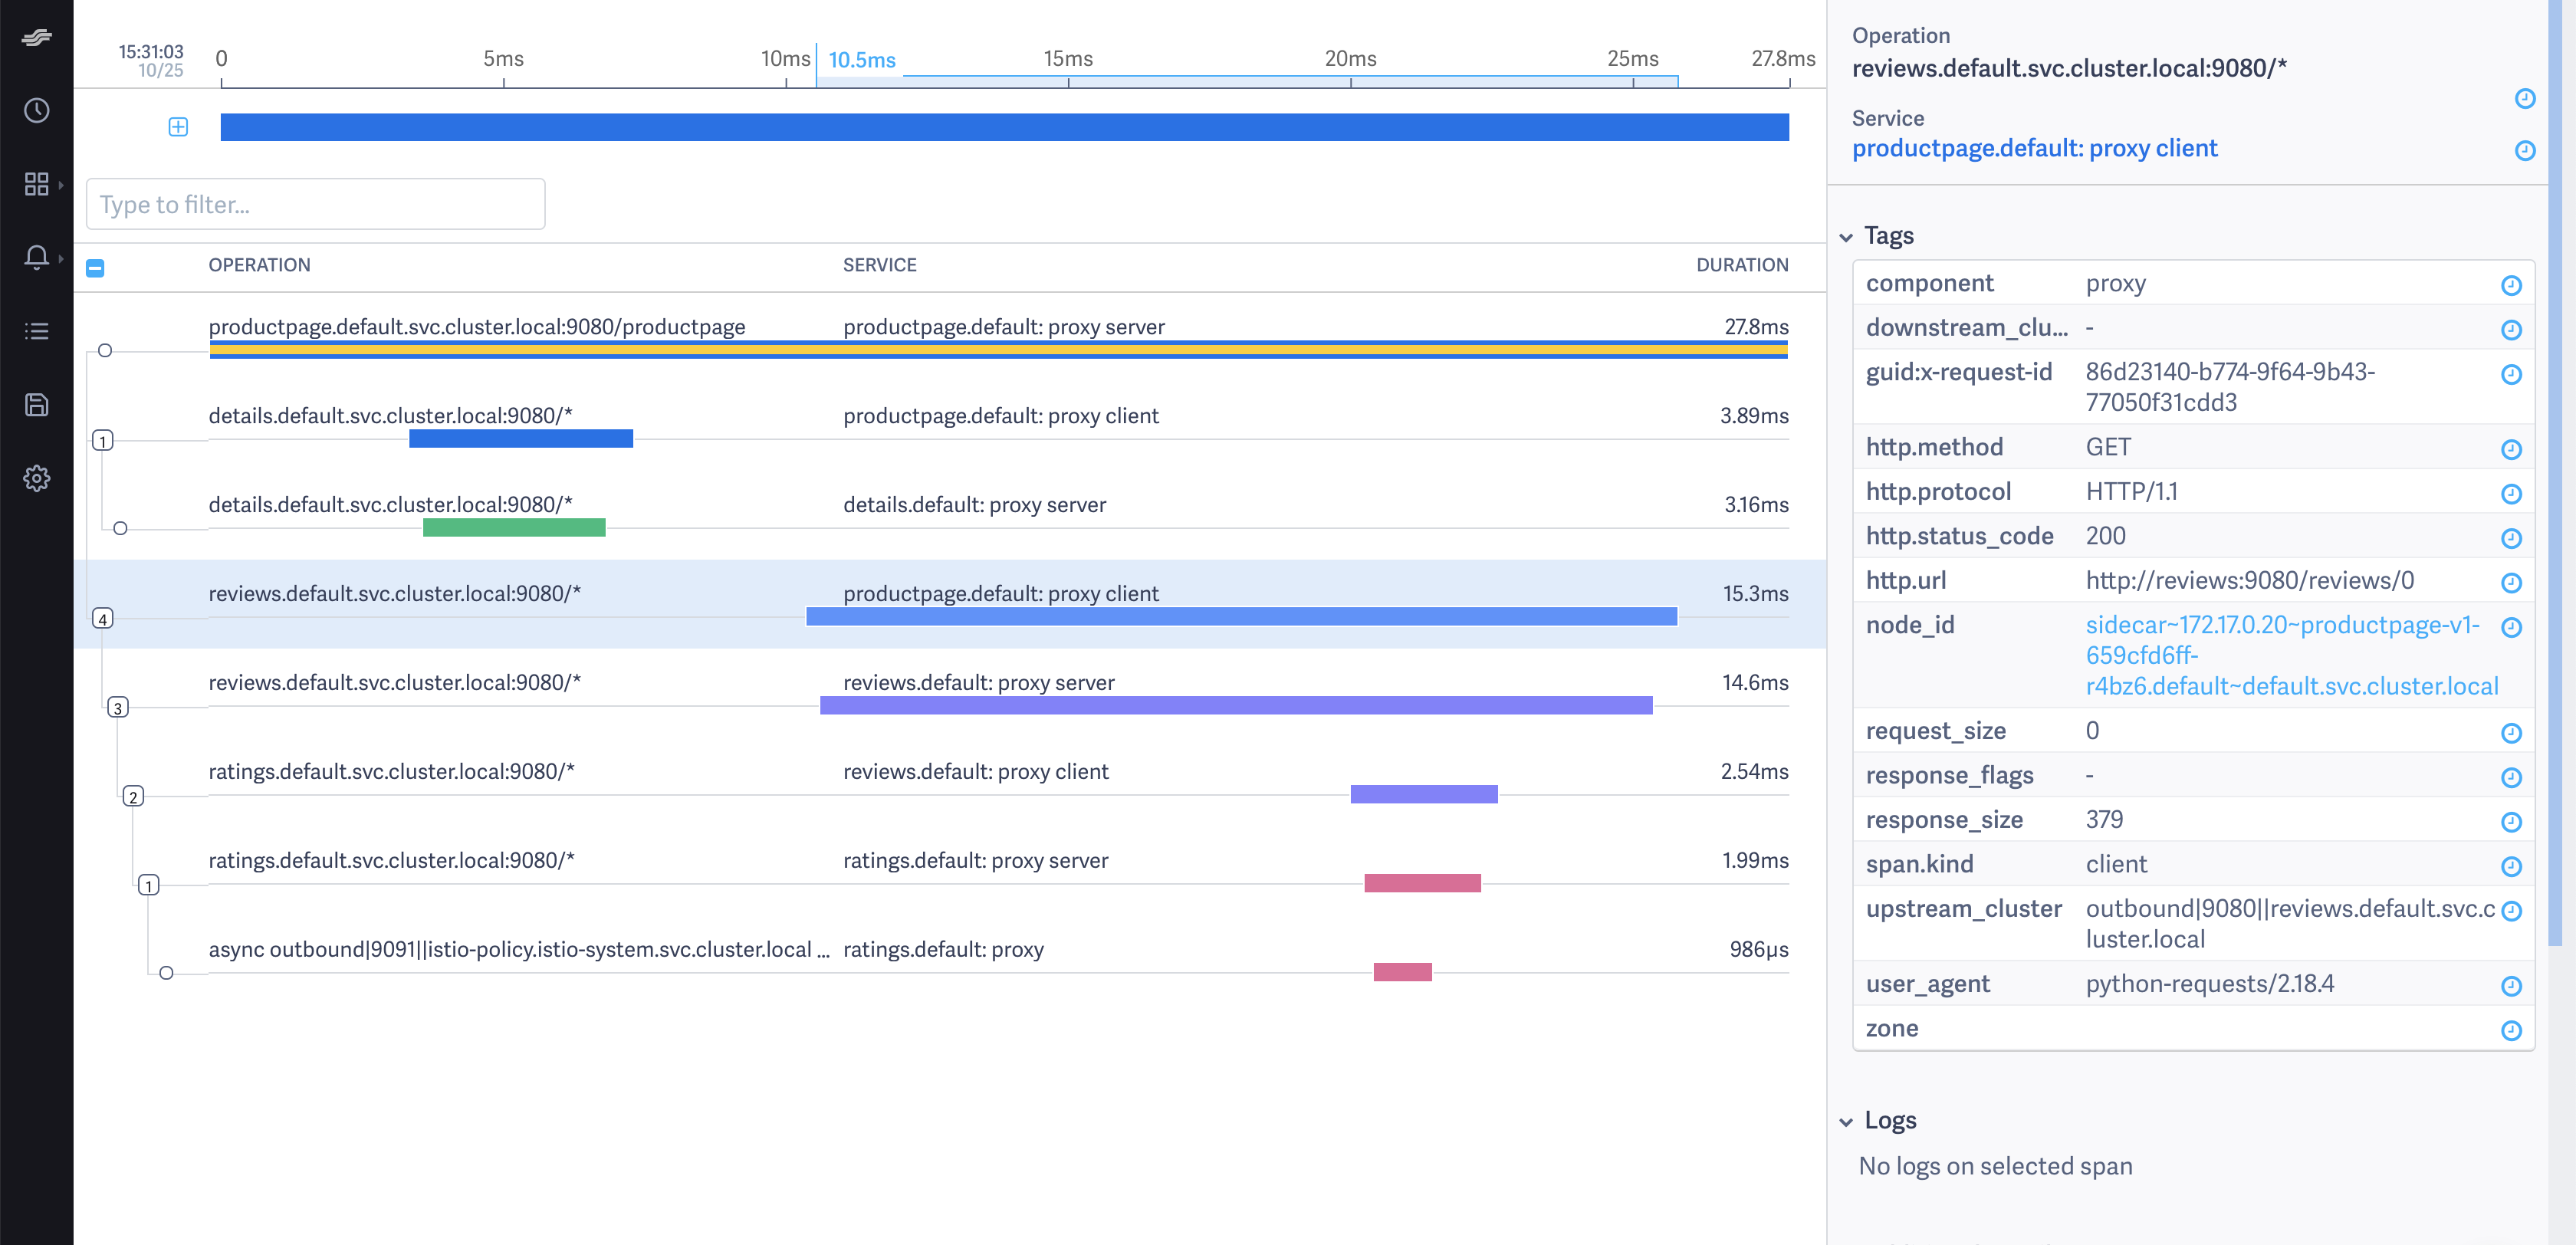
Detailed Trace View
The screenshot shows that the trace is comprised of a set of spans. Each span corresponds to a Bookinfo service invoked
during the execution of a /productpage request.
Two spans in the trace represent every RPC. For example, the call from productpage to reviews starts
with the span labeled with the reviews.default.svc.cluster.local:9080/* operation and the
productpage.default: proxy client service. This service represents the client-side span of the call. The screenshot shows
that the call took 15.30 ms. The second span is labeled with the reviews.default.svc.cluster.local:9080/* operation
and the reviews.default: proxy server service. The second span is a child of the first span and represents the
server-side span of the call. The screenshot shows that the call took 14.60 ms.
Trace sampling
Istio captures traces at a configurable trace sampling percentage. To learn how to modify the trace sampling percentage, visit the Distributed Tracing trace sampling section.
When using Lightstep, we do not recommend reducing the trace sampling percentage below 100%. To handle a high traffic mesh, consider scaling up the size of your satellite pool.
Cleanup
If you are not planning any follow-up tasks, remove the Bookinfo sample application and any Lightstep secrets from your cluster.
To remove the Bookinfo application, refer to the Bookinfo cleanup instructions.
Remove the secret generated for Lightstep:
$ kubectl delete secret lightstep.cacert