Observability
Istio generates detailed telemetry for all service communications within a mesh. This telemetry provides observability of service behavior, empowering operators to troubleshoot, maintain, and optimize their applications – without imposing any additional burdens on service developers. Through Istio, operators gain a thorough understanding of how monitored services are interacting, both with other services and with the Istio components themselves.
Istio generates the following types of telemetry in order to provide overall service mesh observability:
- Metrics. Istio generates a set of service metrics based on the four “golden signals” of monitoring (latency, traffic, errors, and saturation). Istio also provides detailed metrics for the mesh control plane. A default set of mesh monitoring dashboards built on top of these metrics is also provided.
- Distributed Traces. Istio generates distributed trace spans for each service, providing operators with a detailed understanding of call flows and service dependencies within a mesh.
- Access Logs. As traffic flows into a service within a mesh, Istio can generate a full record of each request, including source and destination metadata. This information enables operators to audit service behavior down to the individual workload instance level.
Metrics
Metrics provide a way of monitoring and understanding behavior in aggregate.
To monitor service behavior, Istio generates metrics for all service traffic in, out, and within an Istio service mesh. These metrics provide information on behaviors such as the overall volume of traffic, the error rates within the traffic, and the response times for requests.
In addition to monitoring the behavior of services within a mesh, it is also important to monitor the behavior of the mesh itself. Istio components export metrics on their own internal behaviors to provide insight on the health and function of the mesh control plane.
Istio metrics collection is driven by operator configuration. Operators select how and when to collect metrics, as well as how detailed the metrics themselves should be. This enables operators to flexibly tune metrics collection to meet their individual needs.
Proxy-level metrics
Istio metrics collection begins with the sidecar proxies (Envoy). Each proxy generates a rich set of metrics about all traffic passing through the proxy (both inbound and outbound). The proxies also provide detailed statistics about the administrative functions of the proxy itself, including configuration and health information.
Envoy-generated metrics provide monitoring of the mesh at the granularity of Envoy resources (such as listeners and clusters). As a result, understanding the connection between mesh services and Envoy resources is required for monitoring the Envoy metrics.
Istio enables operators to select which of the Envoy metrics are generated and collected at each workload instance. By default, Istio enables only a small subset of the Envoy-generated statistics to avoid overwhelming metrics backends and to reduce the CPU overhead associated with metrics collection. However, operators can easily expand the set of collected proxy metrics when required. This enables targeted debugging of networking behavior, while reducing the overall cost of monitoring across the mesh.
The Envoy documentation site includes a detailed overview of Envoy statistics collection. The operations guide on Envoy Statistics provides more information on controlling the generation of proxy-level metrics.
Example proxy-level Metrics:
envoy_cluster_internal_upstream_rq{response_code_class="2xx",cluster_name="xds-grpc"} 7163

envoy_cluster_upstream_rq_completed{cluster_name="xds-grpc"} 7164

envoy_cluster_ssl_connection_error{cluster_name="xds-grpc"} 0

envoy_cluster_lb_subsets_removed{cluster_name="xds-grpc"} 0

envoy_cluster_internal_upstream_rq{response_code="503",cluster_name="xds-grpc"} 1
Service-level metrics
In addition to the proxy-level metrics, Istio provides a set of service-oriented metrics for monitoring service communications. These metrics cover the four basic service monitoring needs: latency, traffic, errors, and saturation. Istio ships with a default set of dashboards for monitoring service behaviors based on these metrics.
The default Istio metrics are defined by a set of configuration artifacts that ship with Istio and are exported to Prometheus by default. Operators are free to modify the shape and content of these metrics, as well as to change their collection mechanism, to meet their individual monitoring needs.
The Collecting Metrics task provides more information on customizing Istio metrics generation.
Use of the service-level metrics is entirely optional. Operators may choose to turn off generation and collection of these metrics to meet their individual needs.
Example service-level metric:
istio_requests_total{
  connection_security_policy="mutual_tls",
  destination_app="details",
  destination_principal="cluster.local/ns/default/sa/default",
  destination_service="details.default.svc.cluster.local",
  destination_service_name="details",
  destination_service_namespace="default",
  destination_version="v1",
  destination_workload="details-v1",
  destination_workload_namespace="default",
  reporter="destination",
  request_protocol="http",
  response_code="200",
  response_flags="-",
  source_app="productpage",
  source_principal="cluster.local/ns/default/sa/default",
  source_version="v1",
  source_workload="productpage-v1",
  source_workload_namespace="default"
} 214
Control plane metrics
Each Istio component (Pilot, Galley, Mixer) also provides a collection of self-monitoring metrics. These metrics allow monitoring of the behavior of Istio itself (as distinct from that of the services within the mesh).
For more information on which metrics are maintained, please refer to the reference documentation for each of the components:
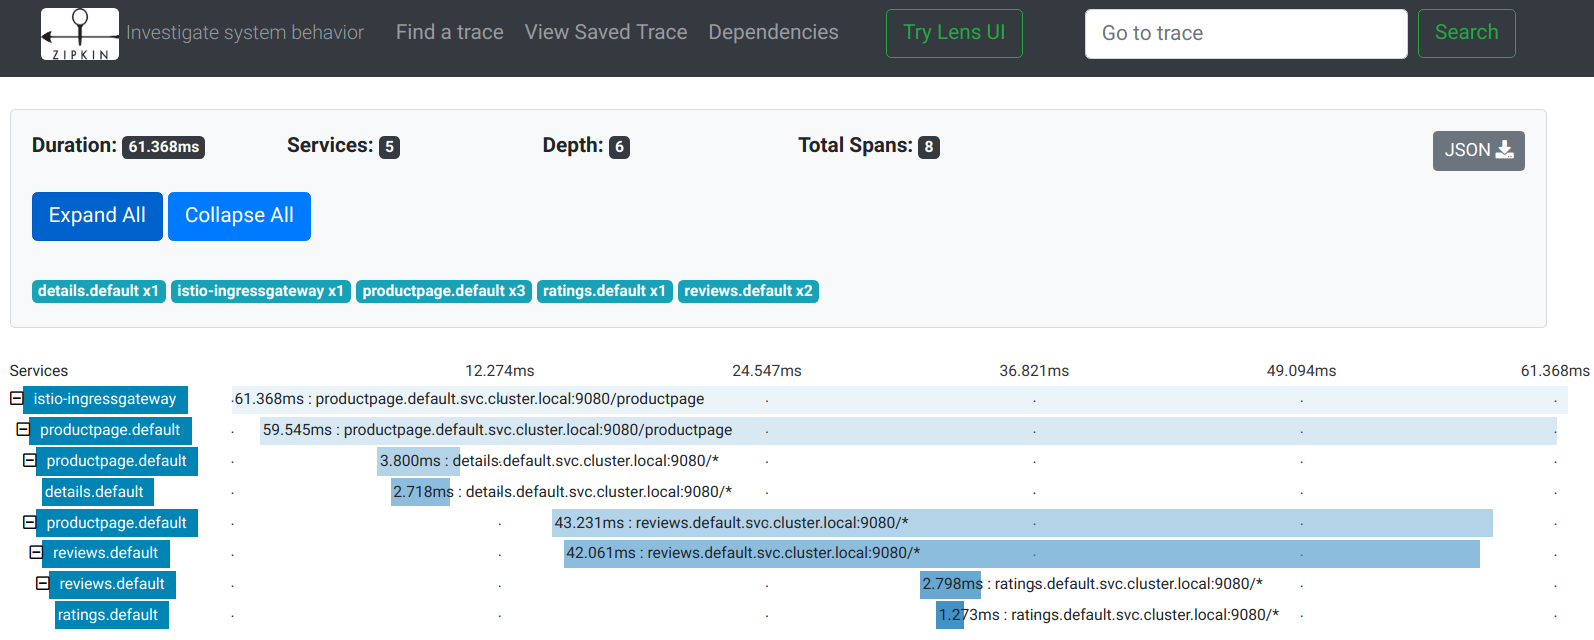
Distributed traces
Distributed tracing provides a way to monitor and understand behavior by monitoring individual requests as they flow through a mesh. Traces empower mesh operators to understand service dependencies and the sources of latency within their service mesh.
Istio supports distributed tracing through the Envoy proxies. The proxies automatically generate trace spans on behalf of the applications they proxy, requiring only that the applications forward the appropriate request context.
Istio supports a number of tracing backends, including Zipkin, Jaeger, LightStep, and Datadog. Operators control the sampling rate for trace generation (that is, the rate at which tracing data is generated per request). This allows operators to control the amount and rate of tracing data being produced for their mesh.
More information about Distributed Tracing with Istio is found in our FAQ on Distributed Tracing.
Example Istio-generated distributed trace for a single request:
Access logs
Access logs provide a way to monitor and understand behavior from the perspective of an individual workload instance.
Istio can generate access logs for service traffic in a configurable set of formats, providing operators with full control of the how, what, when and where of logging. Istio exposes a full set of source and destination metadata to the access logging mechanisms, allowing detailed audit of network transactions.
Access logs may be generated locally or exported to custom backends, including Fluentd.
More information on access logging is provided in the Collecting Logs and the Getting Envoy’s Access Logs tasks.
Example Istio access log (formatted in JSON):
{"level":"info","time":"2019-06-11T20:57:35.424310Z","instance":"accesslog.instance.istio-control","connection_security_policy":"mutual_tls","destinationApp":"productpage","destinationIp":"10.44.2.15","destinationName":"productpage-v1-6db7564db8-pvsnd","destinationNamespace":"default","destinationOwner":"kubernetes://apis/apps/v1/namespaces/default/deployments/productpage-v1","destinationPrincipal":"cluster.local/ns/default/sa/default","destinationServiceHost":"productpage.default.svc.cluster.local","destinationWorkload":"productpage-v1","httpAuthority":"35.202.6.119","latency":"35.076236ms","method":"GET","protocol":"http","receivedBytes":917,"referer":"","reporter":"destination","requestId":"e3f7cffb-5642-434d-ae75-233a05b06158","requestSize":0,"requestedServerName":"outbound_.9080_._.productpage.default.svc.cluster.local","responseCode":200,"responseFlags":"-","responseSize":4183,"responseTimestamp":"2019-06-11T20:57:35.459150Z","sentBytes":4328,"sourceApp":"istio-ingressgateway","sourceIp":"10.44.0.8","sourceName":"ingressgateway-7748774cbf-bvf4j","sourceNamespace":"istio-control","sourceOwner":"kubernetes://apis/apps/v1/namespaces/istio-control/deployments/ingressgateway","sourcePrincipal":"cluster.local/ns/istio-control/sa/default","sourceWorkload":"ingressgateway","url":"/productpage","userAgent":"curl/7.54.0","xForwardedFor":"10.128.0.35"}