Best Practices: Benchmarking Service Mesh Performance
Service meshes add a lot of functionality to application deployments, including traffic policies, observability, and secure communication. But adding a service mesh to your environment comes at a cost, whether that’s time (added latency) or resources (CPU cycles). To make an informed decision on whether a service mesh is right for your use case, it’s important to evaluate how your application performs when deployed with a service mesh.
Earlier this year, we published a blog post on Istio’s performance improvements in version 1.1. Following the release of Istio 1.2, we want to provide guidance and tools to help you benchmark Istio’s data plane performance in a production-ready Kubernetes environment.
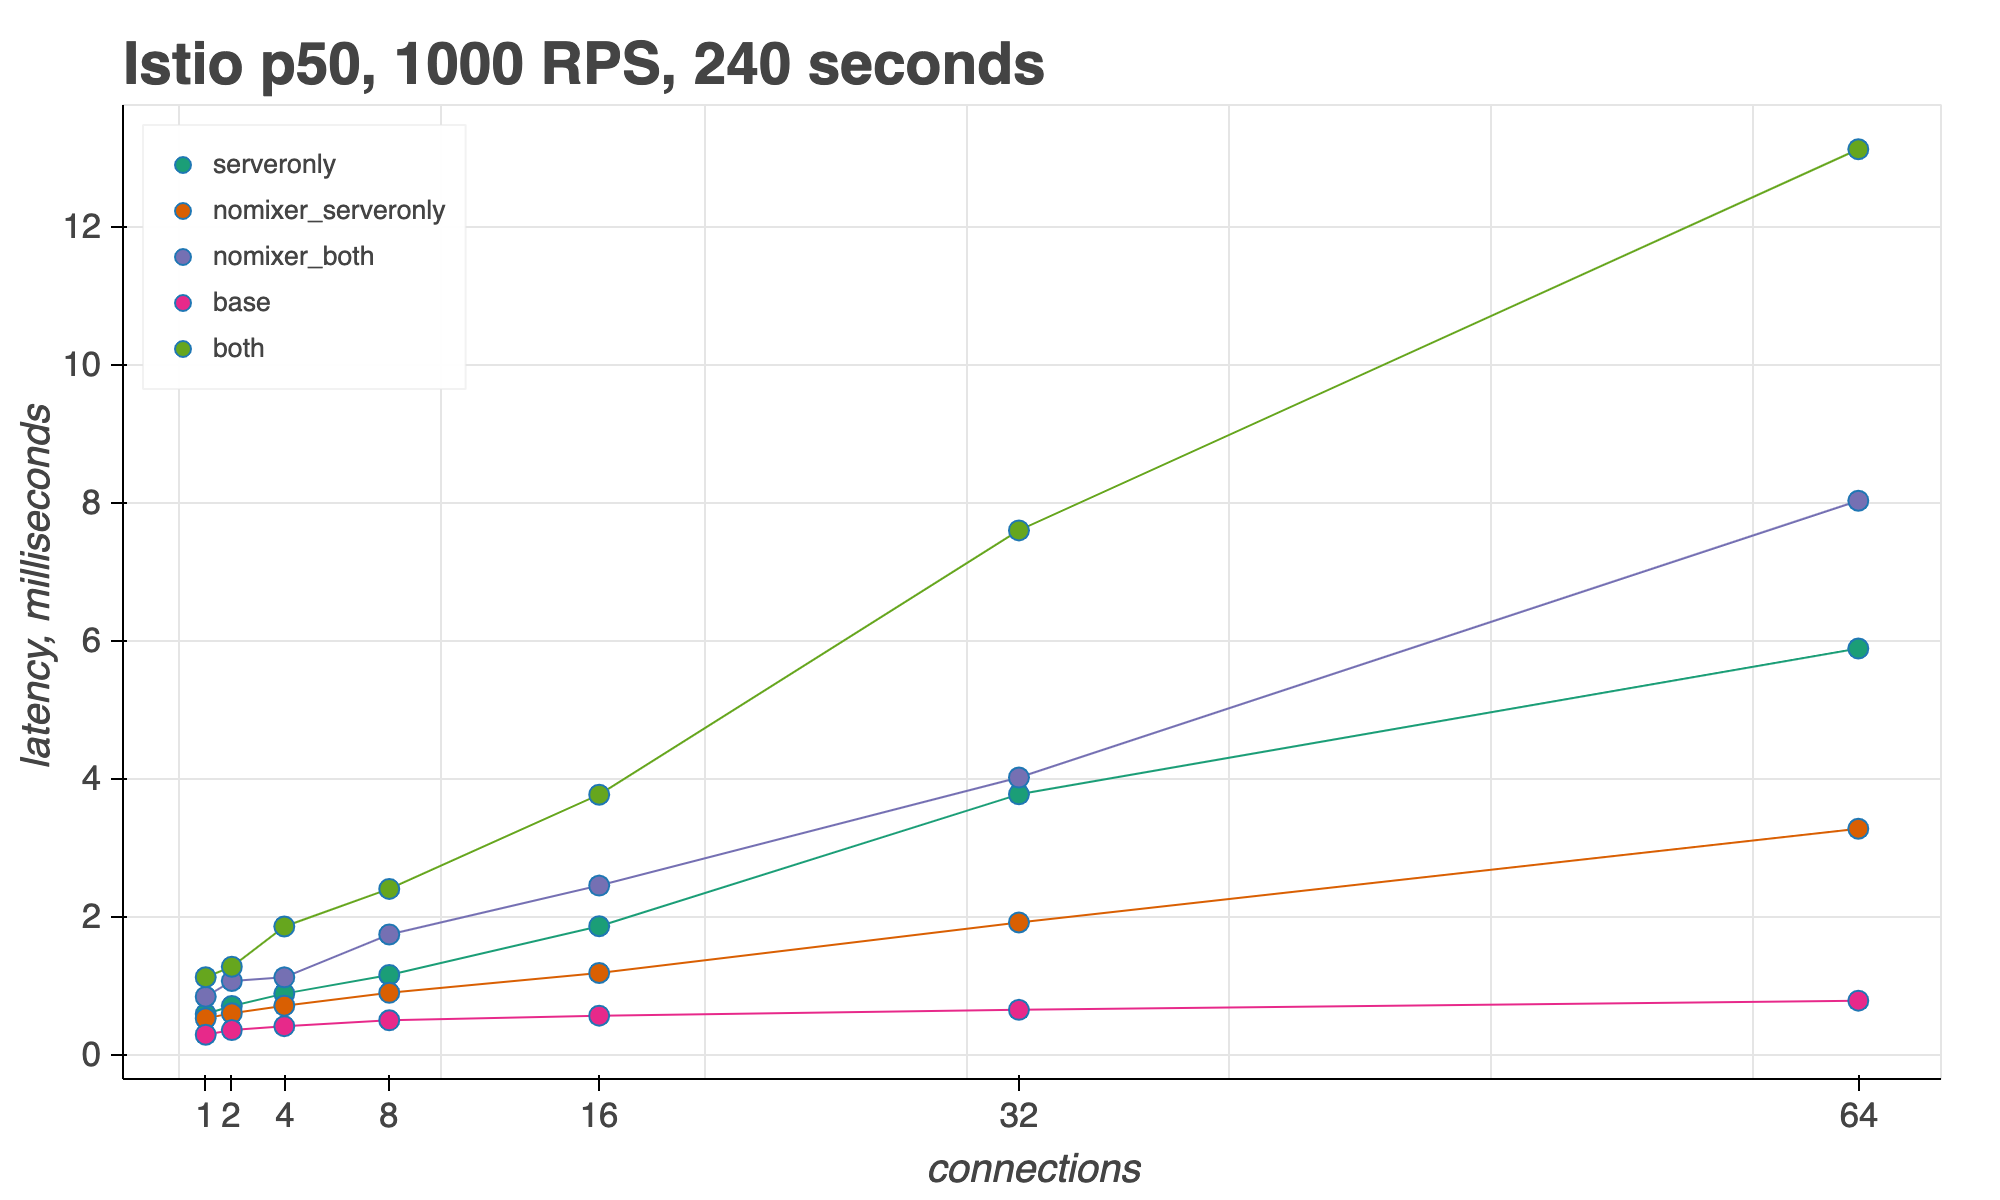
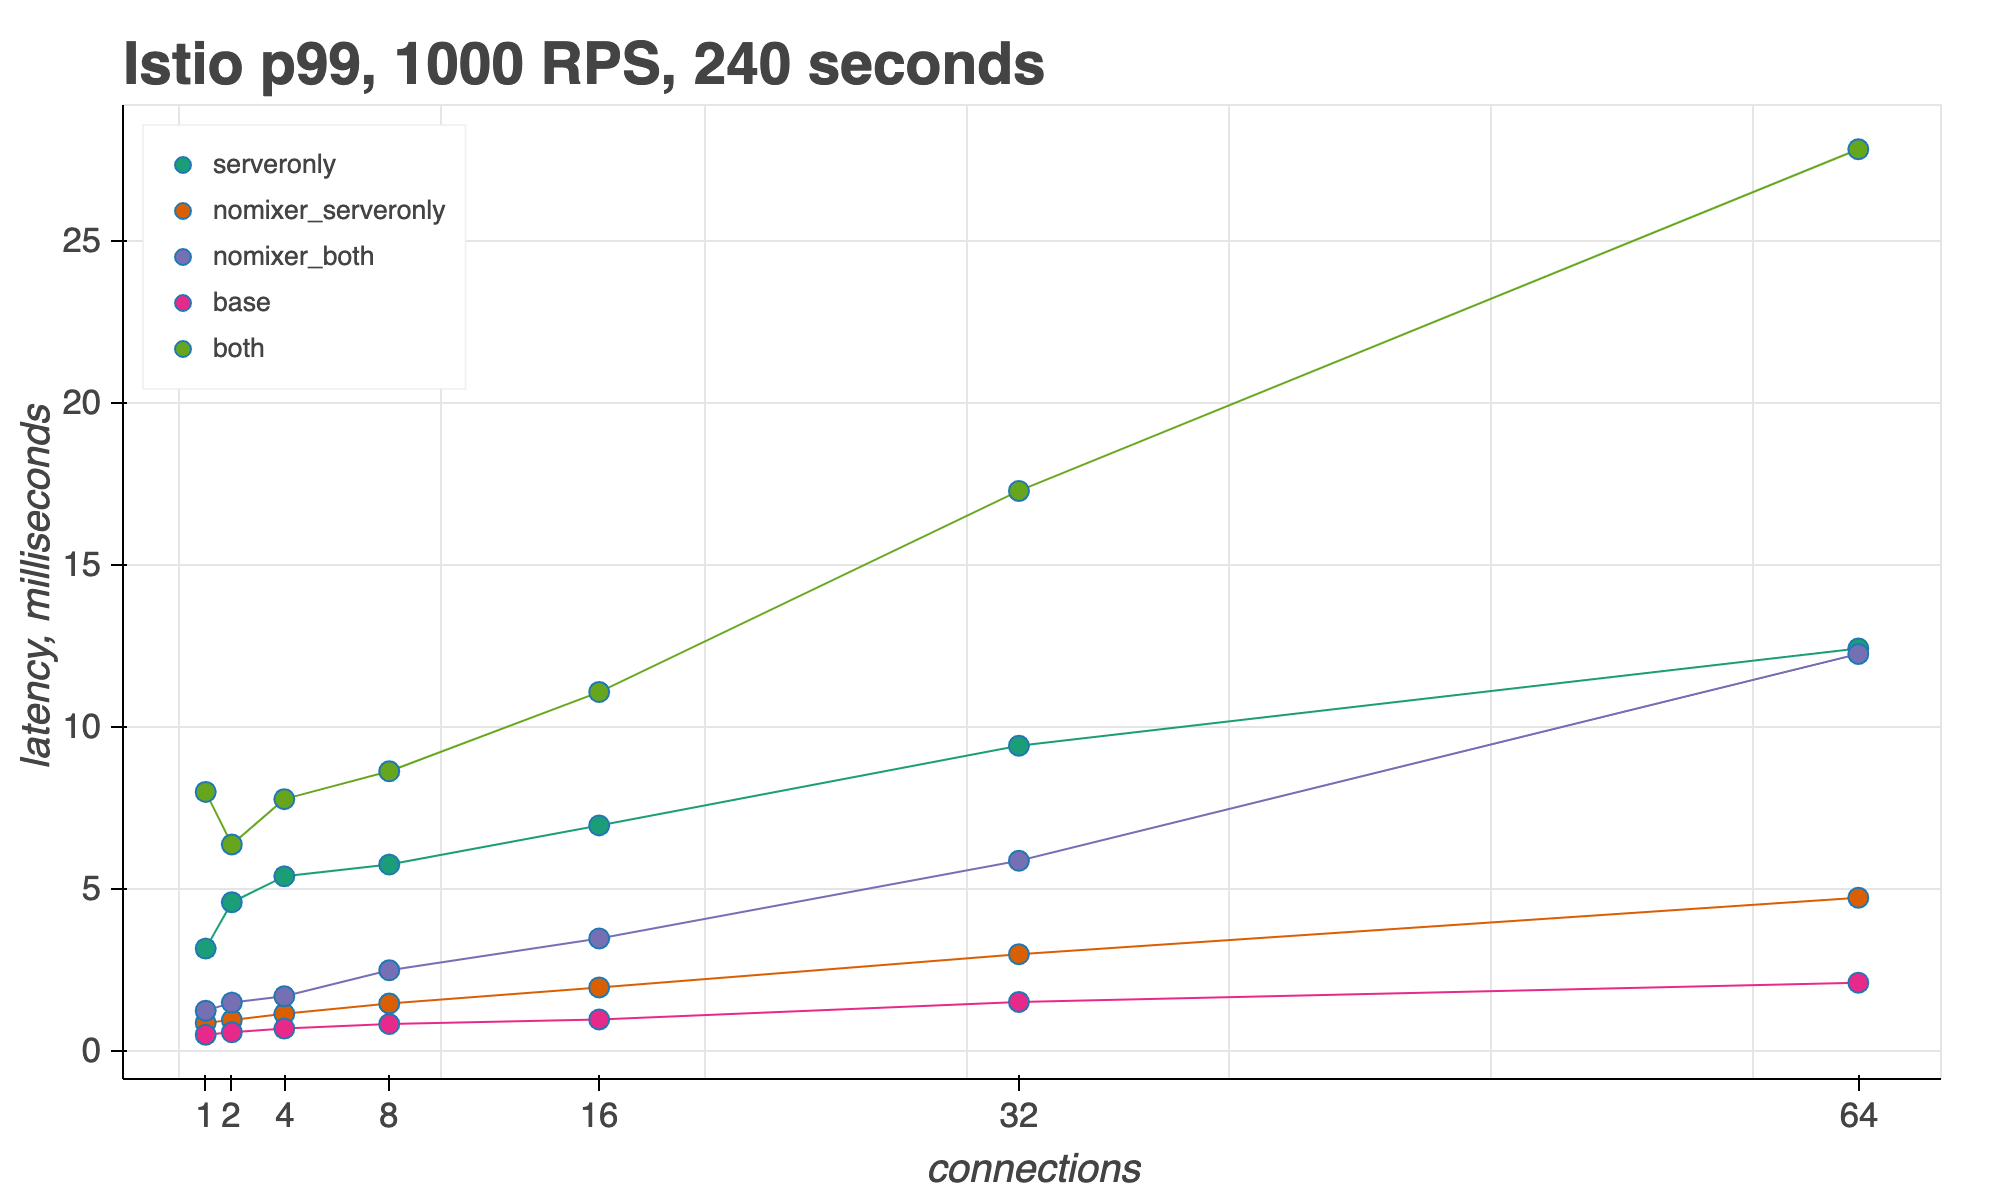
Overall, we found that Istio’s sidecar proxy latency scales with the number of concurrent connections. At 1000 requests per second (RPS), across 16 connections, Istio adds 3 milliseconds per request in the 50th percentile, and 10 milliseconds in the 99th percentile.
In the Istio Tools repository, you’ll find scripts and instructions for measuring Istio’s data plane performance, with additional instructions on how to run the scripts with Linkerd, another service mesh implementation. Follow along as we detail some best practices for each step of the performance test framework.
1. Use a production-ready Istio installation
To accurately measure the performance of a service mesh at scale, it’s important to use an adequately-sized Kubernetes cluster. We test using three worker nodes, each with at least 4 vCPUs and 15 GB of memory.
Then, it’s important to use a production-ready Istio installation profile on that cluster. This lets us achieve performance-oriented settings such as control plane pod autoscaling, and ensures that resource limits are appropriate for heavy traffic load. The default Istio installation is suitable for most benchmarking use cases. For extensive performance benchmarking, with thousands of proxy-injected services, we also provide a tuned Istio install that allocates extra memory and CPU to the Istio control plane.
Istio’s demo installation is not suitable for performance testing, because it is designed to be deployed on a small trial cluster, and has full tracing and access logs enabled to showcase Istio’s features.
2. Focus on the data plane
Our benchmarking scripts focus on evaluating the Istio data plane: the Envoy proxies that mediate traffic between application containers. Why focus on the data plane? Because at scale, with lots of application containers, the data plane’s memory and CPU usage quickly eclipses that of the Istio control plane. Let’s look at an example of how this happens:
Say you run 2,000 Envoy-injected pods, each handling 1,000 requests per second. Each proxy is using 50 MB of memory, and to configure all these proxies, Pilot is using 1 vCPU and 1.5 GB of memory. All together, the Istio data plane (the sum of all the Envoy proxies) is using 100 GB of memory, compared to Pilot’s 1.5 GB.
It is also important to focus on data plane performance for latency reasons. This is because most application requests move through the Istio data plane, not the control plane. There are two exceptions:
- Telemetry reporting: Each proxy sends raw telemetry data to Mixer, which Mixer processes into metrics, traces, and other telemetry. The raw telemetry data is similar to access logs, and therefore comes at a cost. Access log processing consumes CPU and keeps a worker thread from picking up the next unit of work. At higher throughput, it is more likely that the next unit of work is waiting in the queue to be picked up by the worker. This can lead to long-tail (99th percentile) latency for Envoy.
- Custom policy checks: When using custom Istio policy adapters, policy checks are on the request path. This means that request headers and metadata on the data path will be sent to the control plane (Mixer), resulting in higher request latency. Note: These policy checks are disabled by default, as the most common policy use case (RBAC) is performed entirely by the Envoy proxies.
Both of these exceptions will go away in a future Istio release, when Mixer V2 moves all policy and telemetry features directly into the proxies.
Next, when testing Istio’s data plane performance at scale, it’s important to test not only at increasing requests per second, but also against an increasing number of concurrent connections. This is because real-world, high-throughput traffic comes from multiple clients. The provided scripts allow you to perform the same load test with any number of concurrent connections, at increasing RPS.
Lastly, our test environment measures requests between two pods, not many. The client pod is Fortio, which sends traffic to the server pod.
Why test with only two pods? Because scaling up throughput (RPS) and connections (threads) has a greater effect on Envoy’s performance than increasing the total size of the service registry — or, the total number of pods and services in the Kubernetes cluster. When the size of the service registry grows, Envoy does have to keep track of more endpoints, and lookup time per request does increase, but by a tiny constant. If you have many services, and this constant becomes a latency concern, Istio provides a Sidecar resource, which allows you to limit which services each Envoy knows about.
3. Measure with and without proxies
While many Istio features, such as mutual TLS authentication, rely on an Envoy proxy next to an application pod, you can selectively disable sidecar proxy injection for some of your mesh services. As you scale up Istio for production, you may want to incrementally add the sidecar proxy to your workloads.
To that end, the test scripts provide three different modes. These modes analyze Istio’s performance when a request goes through both the client and server proxies (both), just the server proxy (serveronly), and neither proxy (baseline).
You can also disable Mixer to stop Istio’s telemetry during the performance tests, which provides results in line with the performance we expect when the Mixer V2 work is completed. Istio also supports Envoy native telemetry, which performs similarly to having Istio’s telemetry disabled.
Istio 1.2 Performance
Let’s see how to use this test environment to analyze the data plane performance of Istio 1.2. We also provide instructions to run the same performance tests for the Linkerd data plane. Currently, only latency benchmarking is supported for Linkerd.
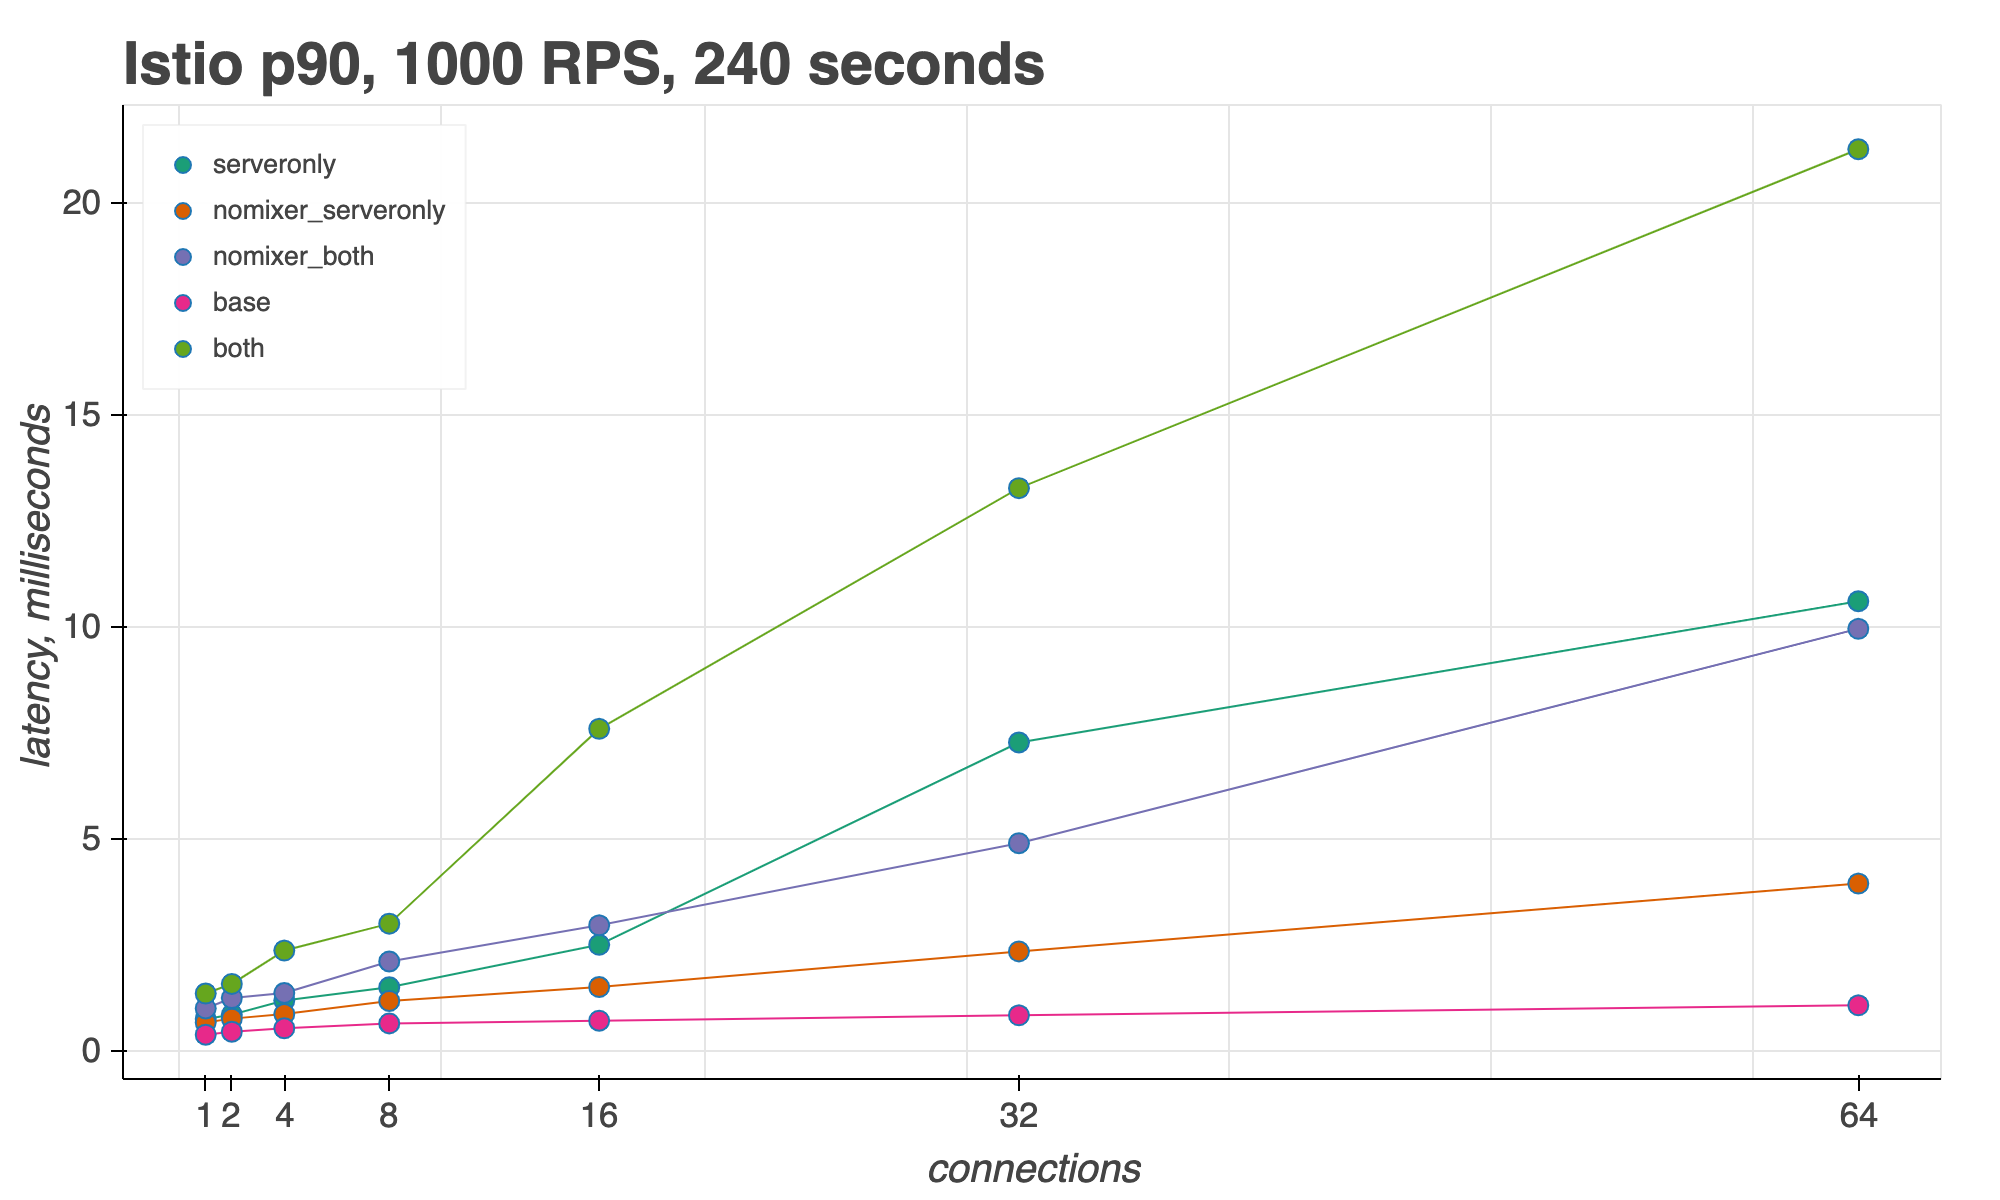
For measuring Istio’s sidecar proxy latency, we look at the 50th, 90th, and 99th percentiles for an increasing number of concurrent connections,keeping request throughput (RPS) constant.
We found that with 16 concurrent connections and 1000 RPS, Istio adds 3ms over the baseline (P50) when a request travels through both a client and server proxy. (Subtract the pink line, base, from the green line, both.) At 64 concurrent connections, Istio adds 12ms over the baseline, but with Mixer disabled (nomixer_both), Istio only adds 7ms.
In the 90th percentile, with 16 concurrent connections, Istio adds 6ms; with 64 connections, Istio adds 20ms.
Finally, in the 99th percentile, with 16 connections, Istio adds 10ms over the baseline. At 64 connections, Istio adds 25ms with Mixer, or 10ms without Mixer.
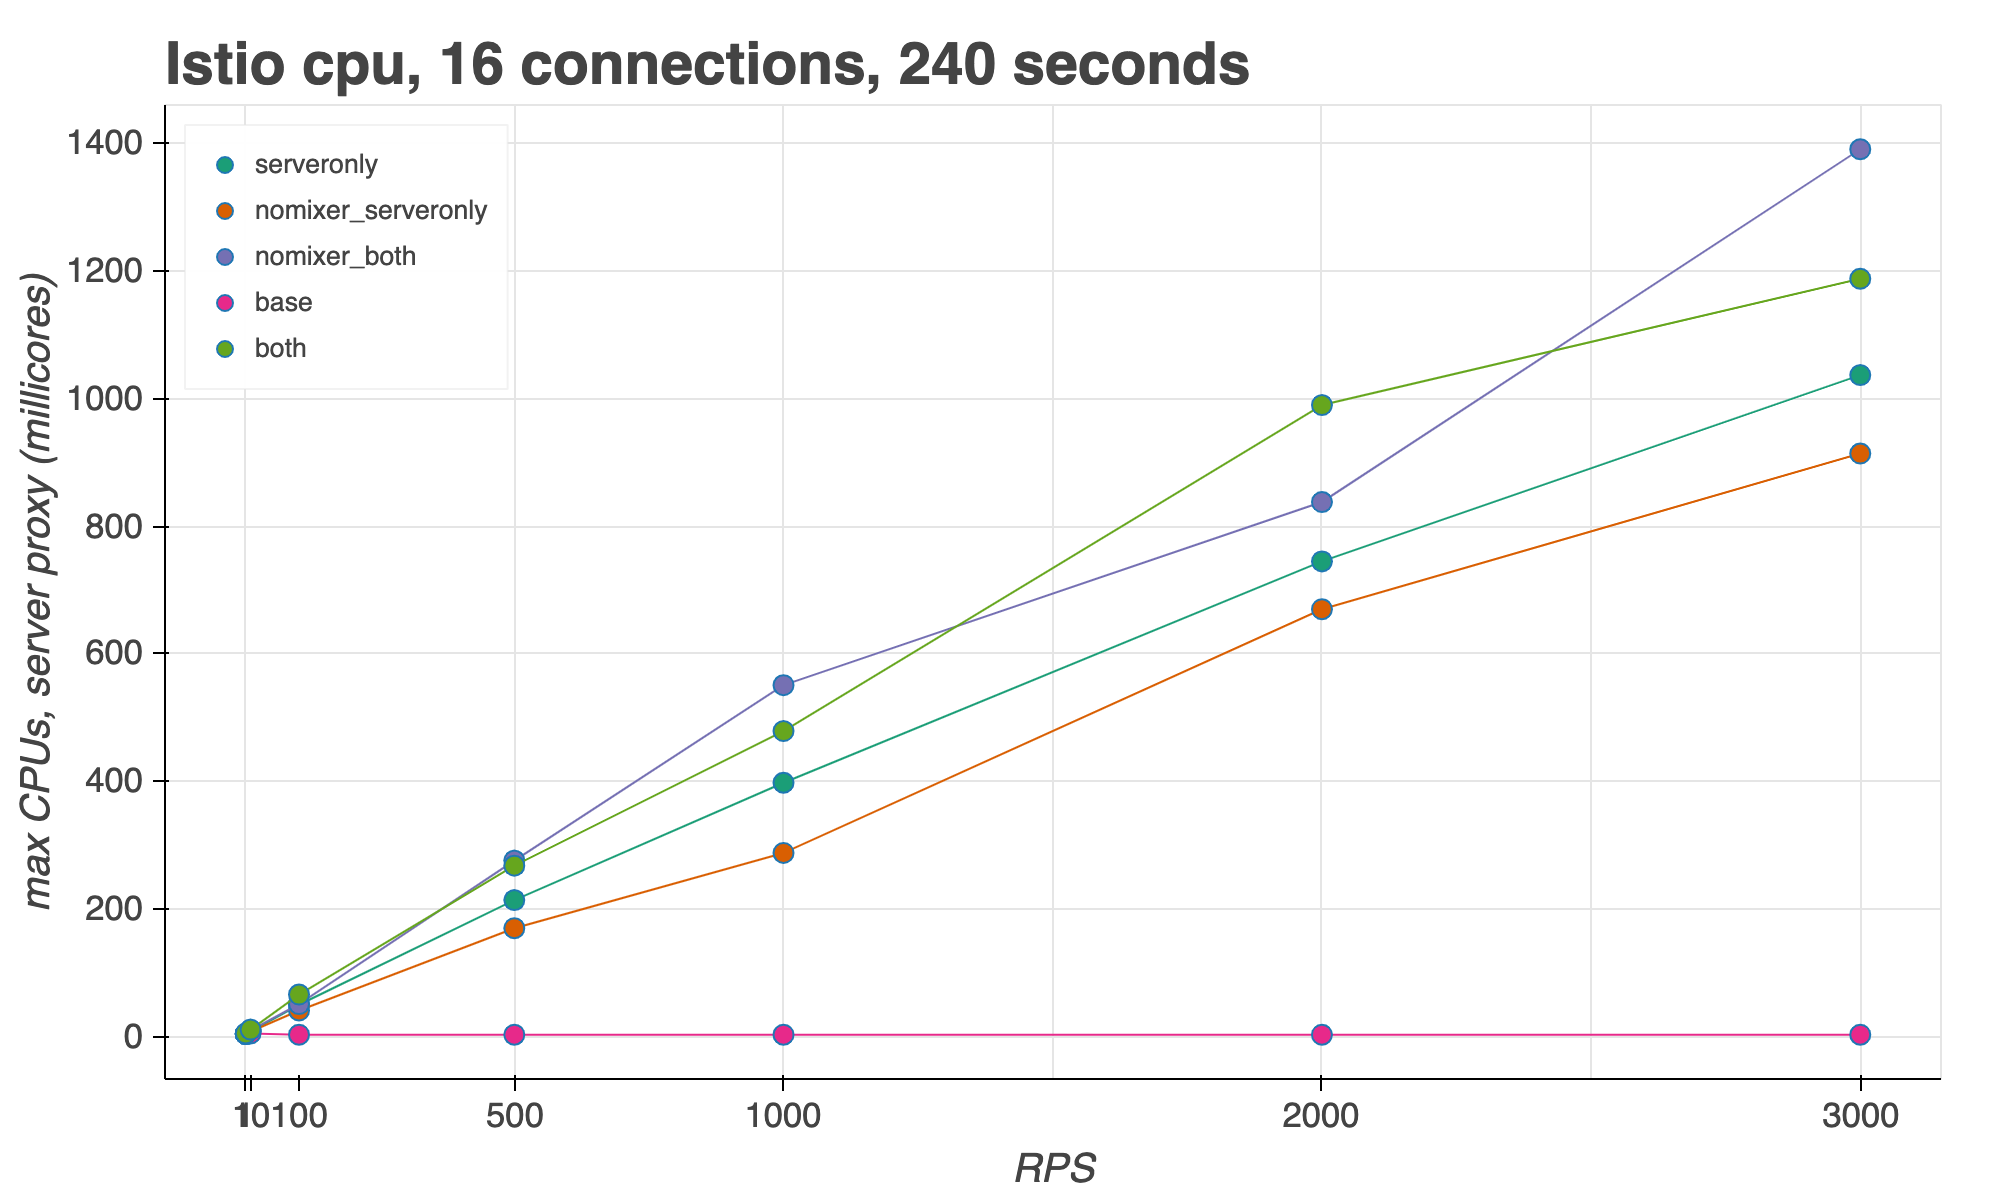
For CPU usage, we measured with an increasing request throughput (RPS), and a constant number of concurrent connections. We found that Envoy’s maximum CPU usage at 3000 RPS, with Mixer enabled, was 1.2 vCPUs. At 1000 RPS, one Envoy uses approximately half of a CPU.
Summary
In the process of benchmarking Istio’s performance, we learned several key lessons:
- Use an environment that mimics production.
- Focus on data plane traffic.
- Measure against a baseline.
- Increase concurrent connections as well as total throughput.
For a mesh with 1000 RPS across 16 connections, Istio 1.2 adds just 3 milliseconds of latency over the baseline, in the 50th percentile.
Also check out the Istio Performance and Scalability guide for the most up-to-date performance data for current and future releases.
Thank you for reading, and happy benchmarking!


