Apache SkyWalking
After completing this task, you will understand how to have your application participate in tracing with Apache SkyWalking, regardless of the language, framework, or platform you use to build it.
This task uses the Bookinfo sample as the example application.
To learn how Istio handles tracing, visit the Distributed Tracing Overview section.
Configure tracing
If you used an IstioOperator CR to install Istio, add the following field to your configuration:
apiVersion: install.istio.io/v1alpha1
kind: IstioOperator
spec:
  meshConfig:
    defaultProviders:
      tracing:
      - "skywalking"
    enableTracing: true
    extensionProviders:
    - name: "skywalking"
      skywalking:
        service: tracing.istio-system.svc.cluster.local
        port: 11800
With this configuration, Istio is installed with a SkyWalking Agent as the default tracer. Trace data will be sent to a SkyWalking backend.
In the default profile, the sampling rate is 1%. Increase it to 100% using the Telemetry API:
$ kubectl apply -f - <<EOF
apiVersion: telemetry.istio.io/v1alpha1
kind: Telemetry
metadata:
  name: mesh-default
  namespace: istio-system
spec:
  tracing:
  - randomSamplingPercentage: 100.00
EOF
Deploy the SkyWalking Collector
Follow the SkyWalking installation documentation to deploy SkyWalking into your cluster.
Deploy the Bookinfo Application
Deploy the Bookinfo sample application.
Accessing the dashboard
Remotely Accessing Telemetry Addons details how to configure access to the Istio addons through a gateway.
For testing (and temporary access), you may also use port-forwarding. Use the following, assuming you’ve deployed SkyWalking to the istio-system namespace:
$ istioctl dashboard skywalking
Generating traces using the Bookinfo sample
When the Bookinfo application is up and running, access
http://$GATEWAY_URL/productpageone or more times to generate trace information.To see trace data, you must send requests to your service. The number of requests depends on Istio’s sampling rate and can be configured using the Telemetry API. With the default sampling rate of 1%, you need to send at least 100 requests before the first trace is visible. To send a 100 requests to the
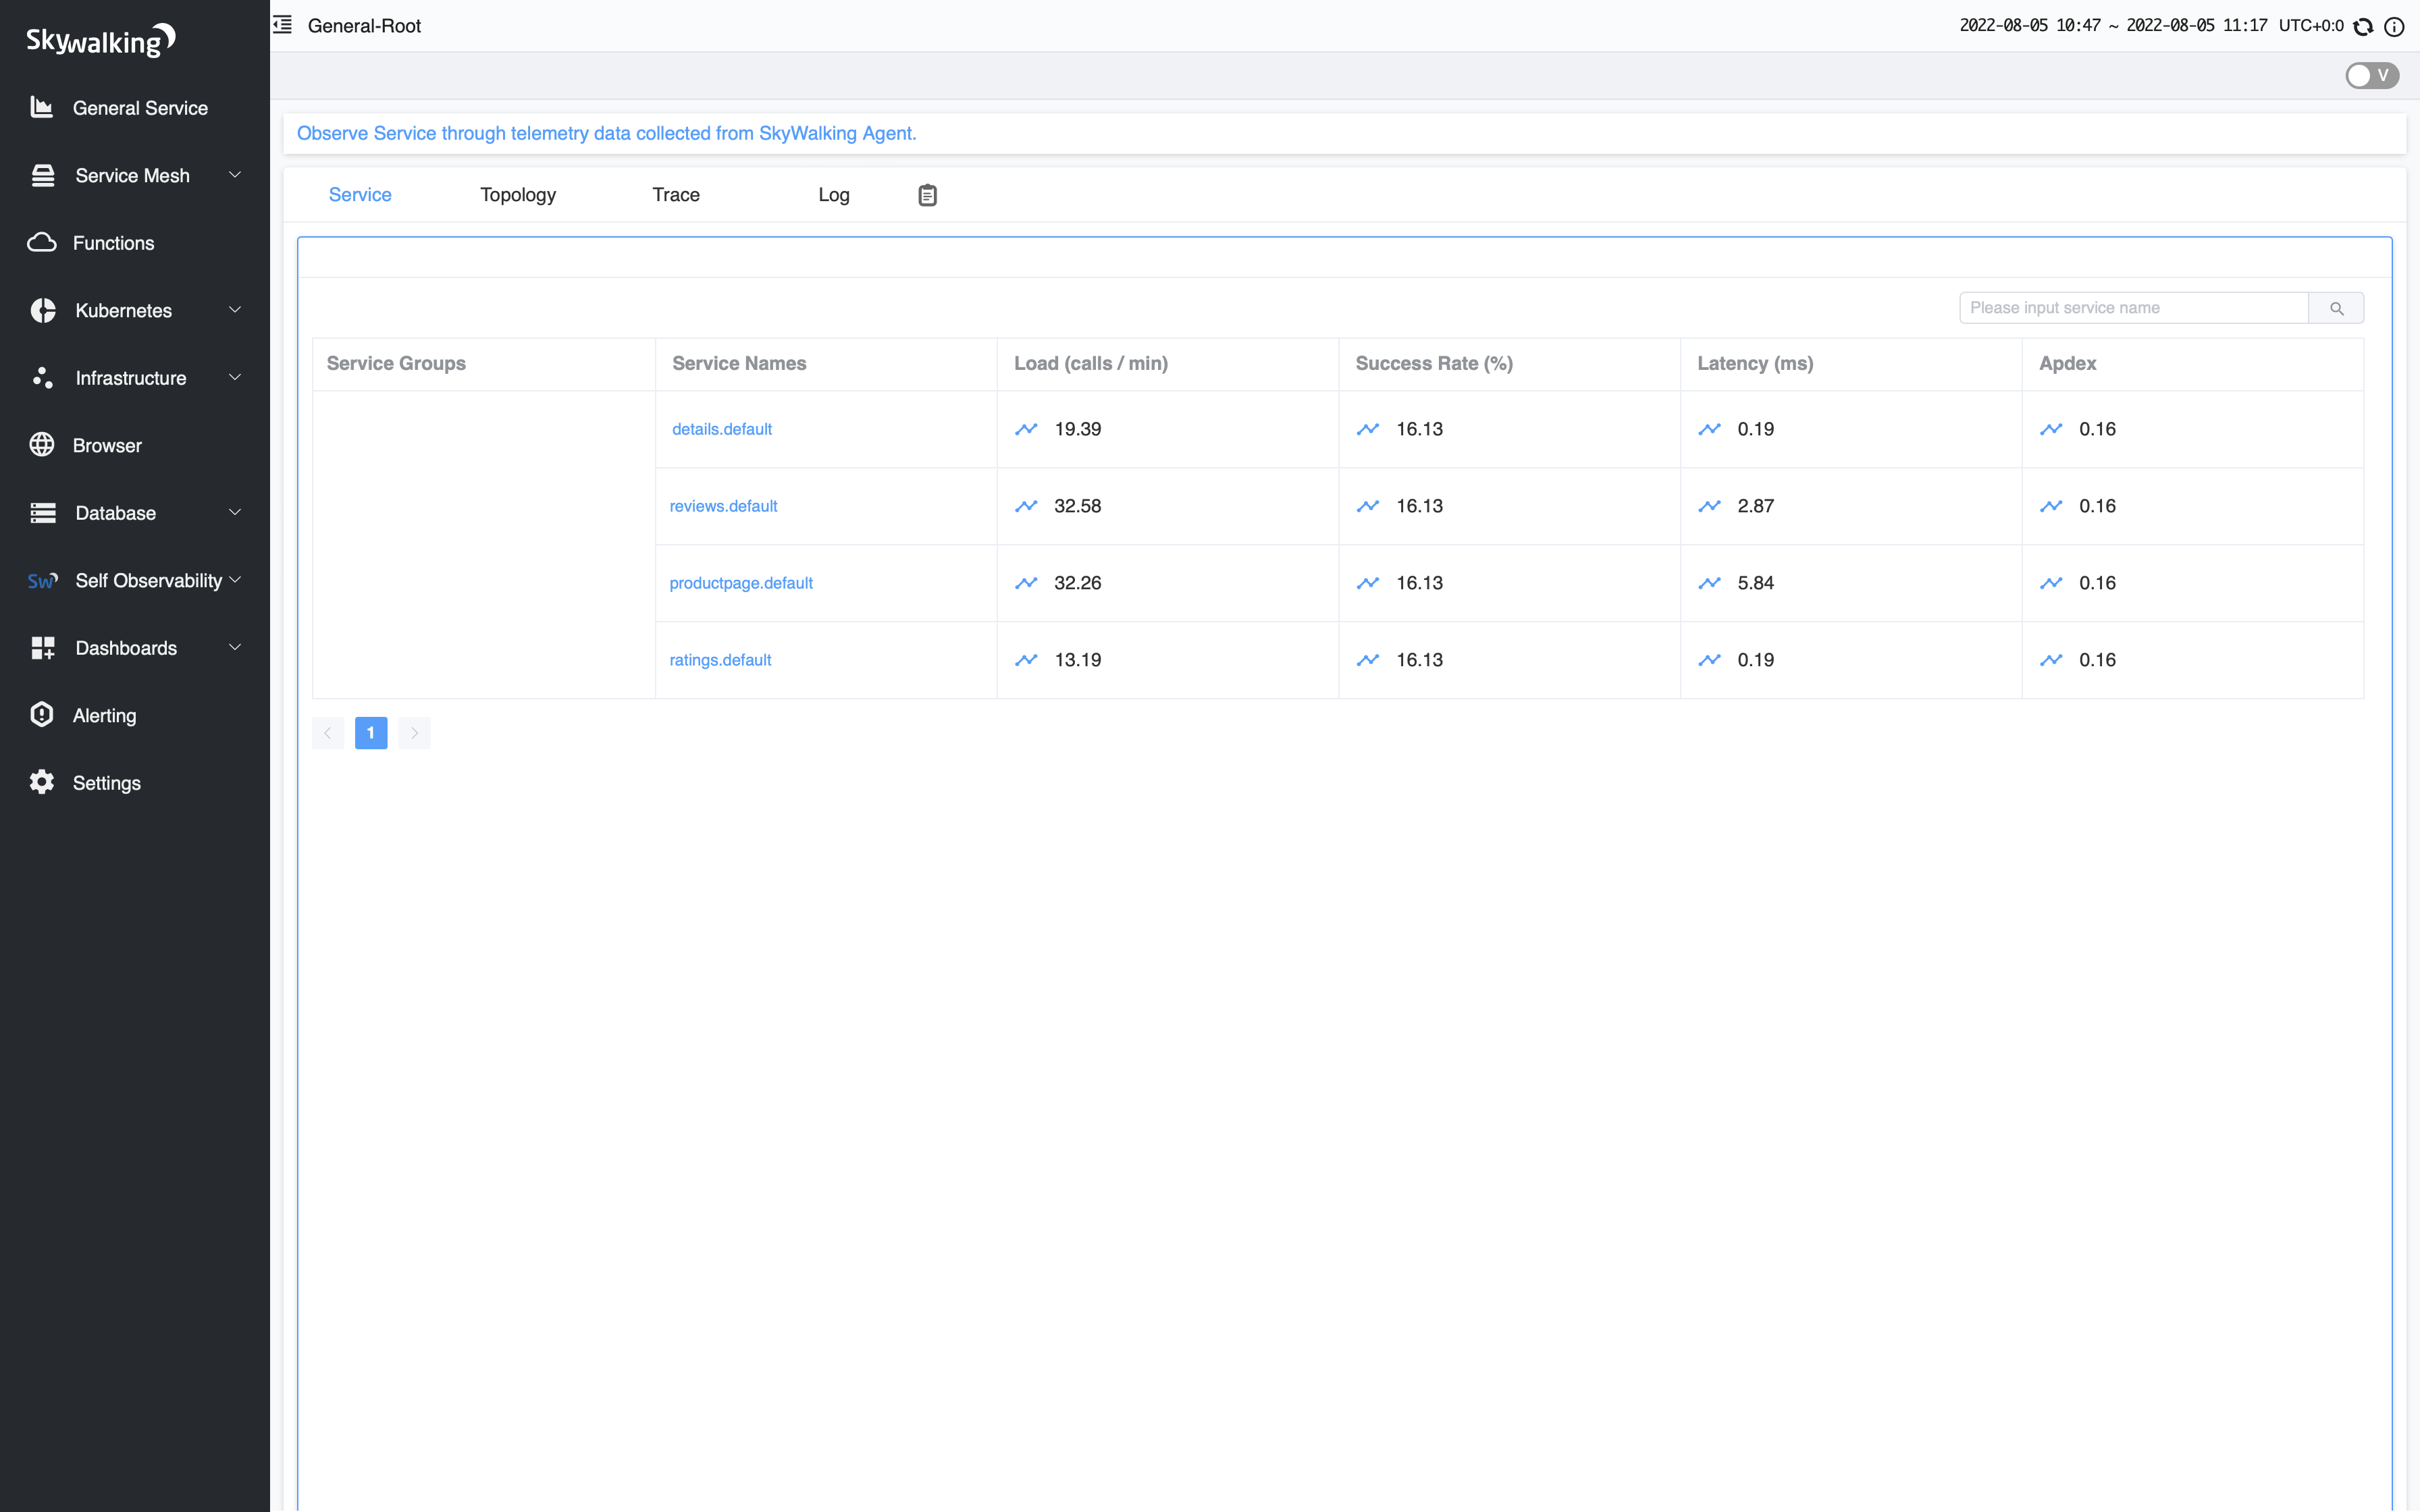
productpageservice, use the following command:$ for i in $(seq 1 100); do curl -s -o /dev/null "http://$GATEWAY_URL/productpage"; doneFrom the “General Service” panel, you can see the service list.
Service List Select the
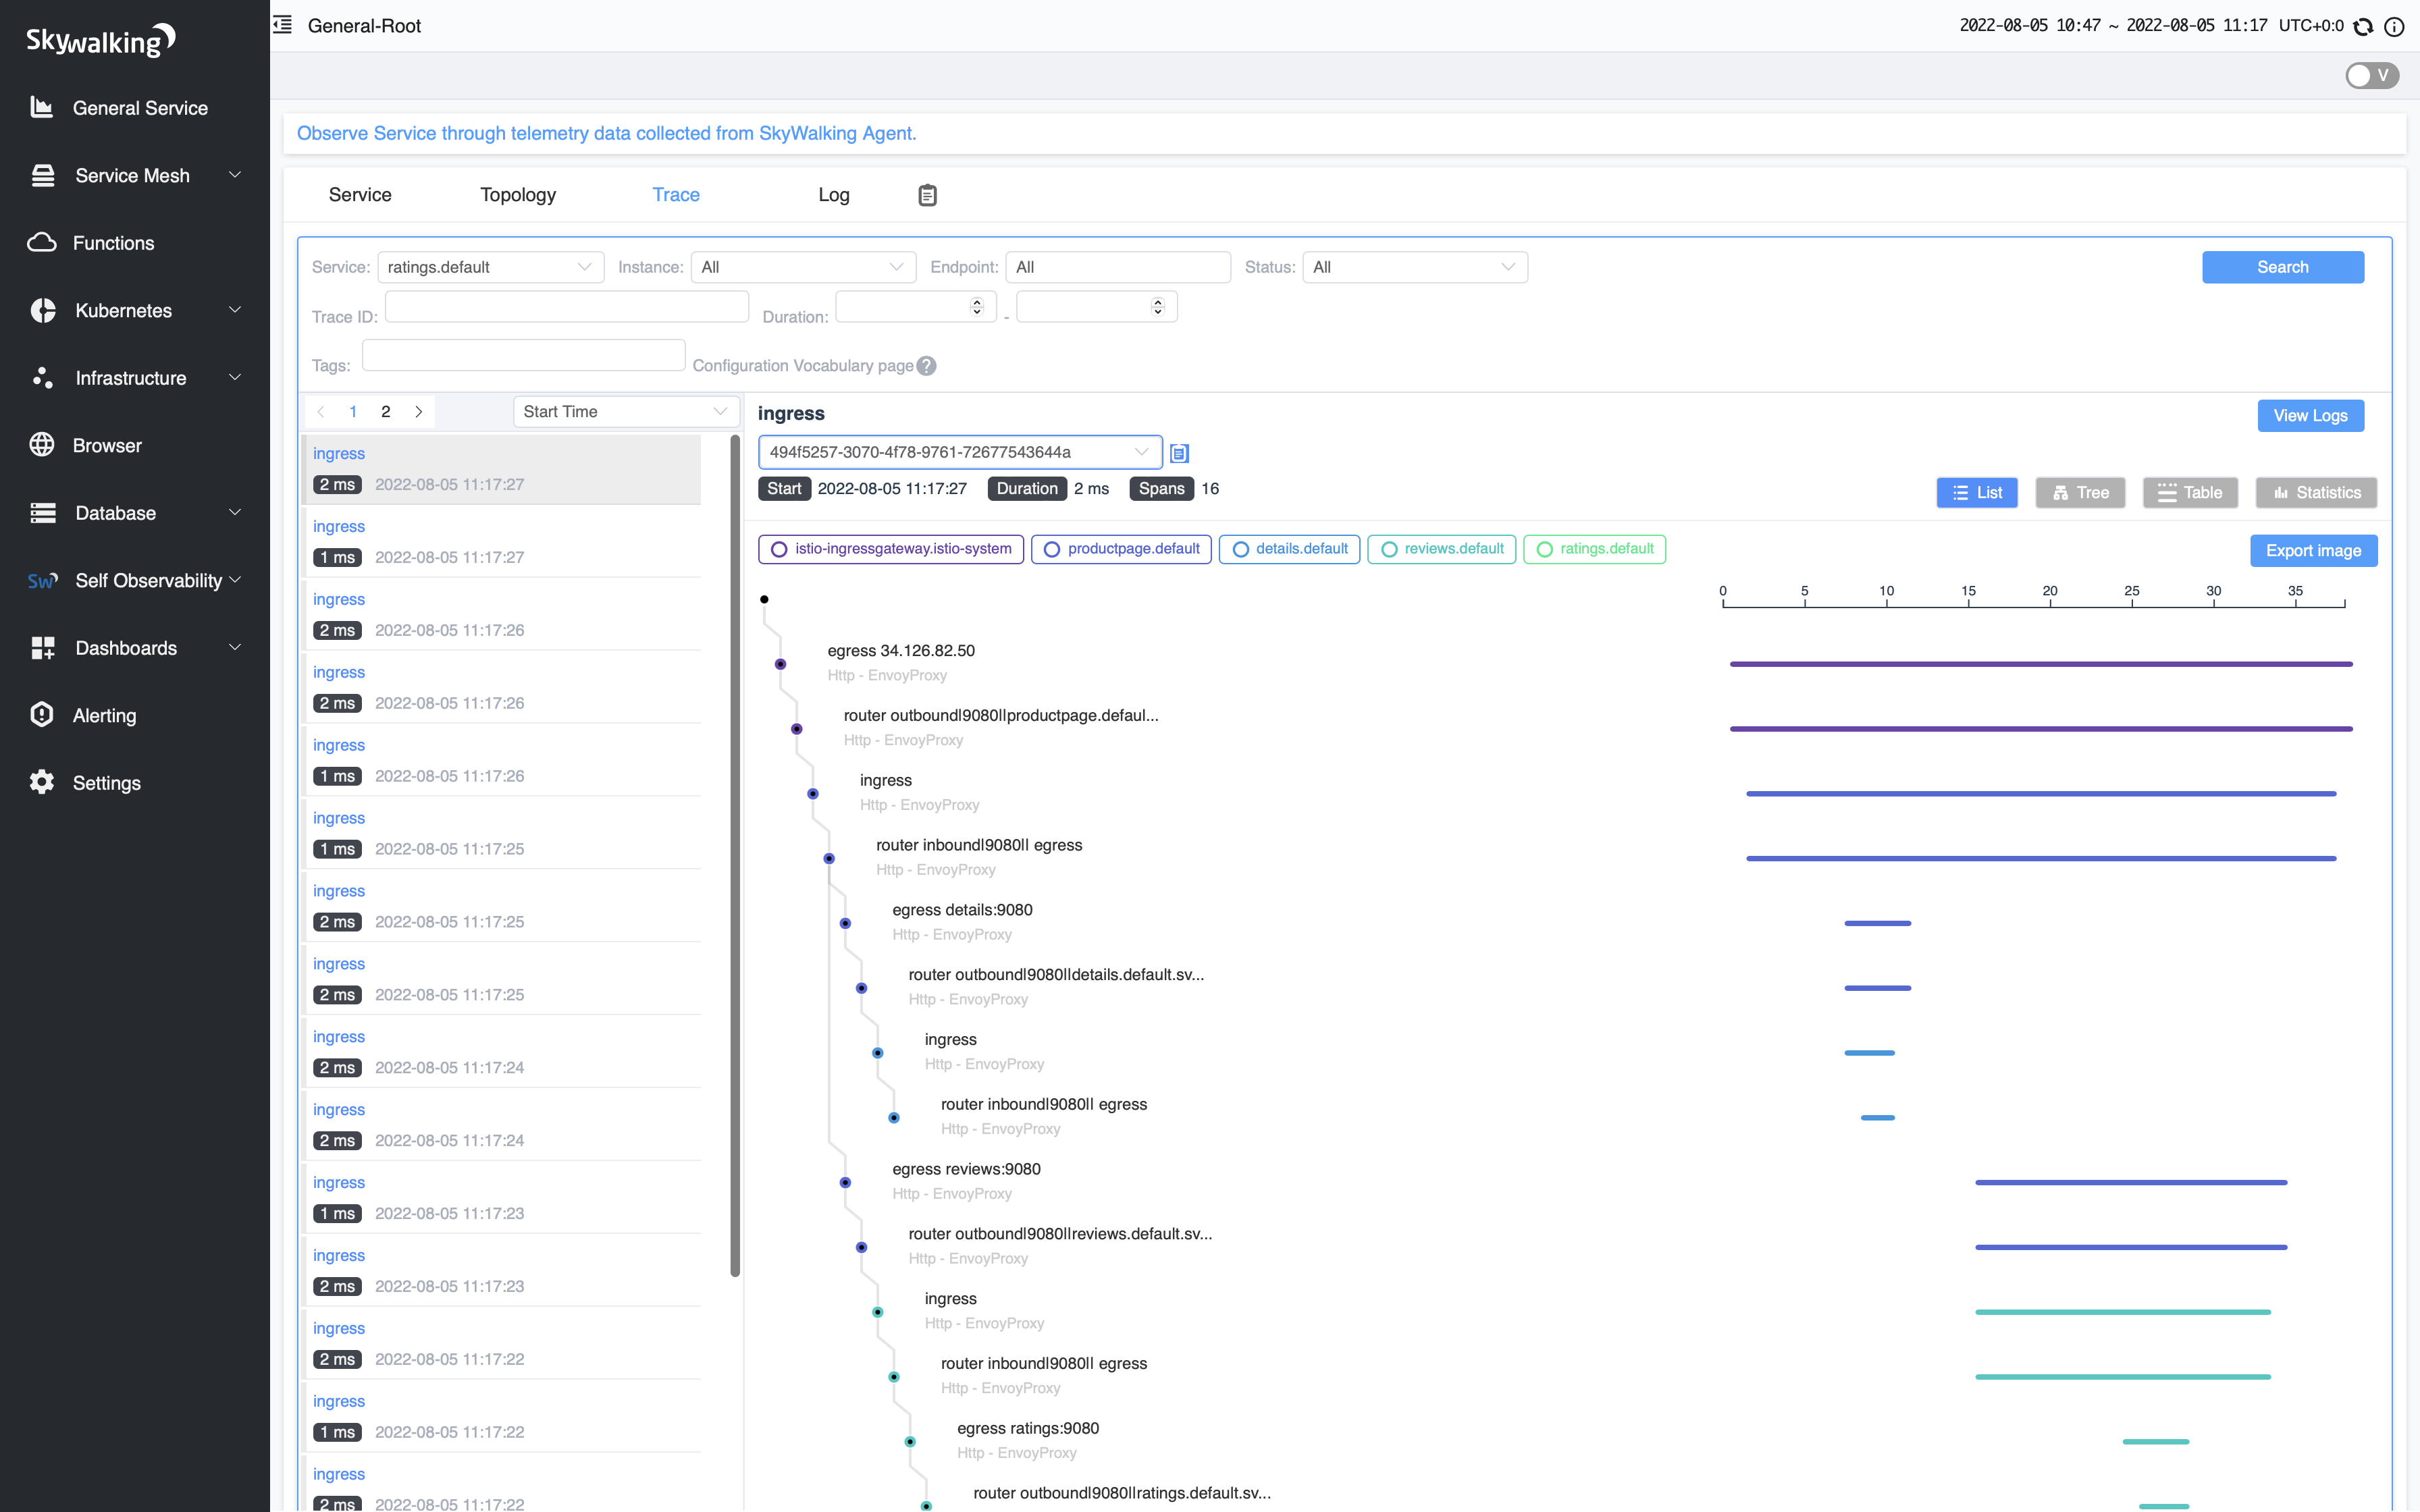
Tracetab in the main content. You can see the trace list in the left sidebar and the trace details in the right panel:Trace View The trace is comprised of a set of spans, where each span corresponds to a Bookinfo service, invoked during the execution of a
/productpagerequest, or internal Istio component, for example:istio-ingressgateway.
Explore SkyWalking’s official demo application
In this tutorial, we use the Bookinfo sample application, in this sample application there is no SkyWalking agent installed to the services, all the traces are generated by the sidecar proxies.
If you want to explore more about SkyWalking’s language agents, the SkyWalking team also provides a demo application that is integrated with the language agents and you can have more detailed traces as well as other language agent specific features such as profiling.
Cleanup
Remove any
istioctlprocesses that may still be running using control-C or:$ killall istioctlIf you are not planning to explore any follow-on tasks, refer to the Bookinfo cleanup instructions to shutdown the application.

