Visualizing Metrics with Grafana
This task shows you how to setup and use the Istio Dashboard to monitor mesh traffic. As part of this task, you will use the Grafana Istio addon and the web-based interface for viewing service mesh traffic data.
The Bookinfo sample application is used as the example application throughout this task.
Before you begin
- Install Istio in your cluster.
- Install the Grafana Addon.
- Install the Prometheus Addon.
- Deploy the Bookinfo application.
Viewing the Istio dashboard
Verify that the
prometheusservice is running in your cluster.In Kubernetes environments, execute the following command:
$ kubectl -n istio-system get svc prometheus
NAME         TYPE        CLUSTER-IP       EXTERNAL-IP   PORT(S)    AGE
prometheus   ClusterIP   10.100.250.202   <none>        9090/TCP   103s
Verify that the Grafana service is running in your cluster.
In Kubernetes environments, execute the following command:
$ kubectl -n istio-system get svc grafana
NAME      TYPE        CLUSTER-IP       EXTERNAL-IP   PORT(S)    AGE
grafana   ClusterIP   10.103.244.103   <none>        3000/TCP   2m25s
Open the Istio Dashboard via the Grafana UI.
In Kubernetes environments, execute the following command:
$ istioctl dashboard grafanaVisit http://localhost:3000/d/G8wLrJIZk/istio-mesh-dashboard in your web browser.
The Istio Dashboard will look similar to:
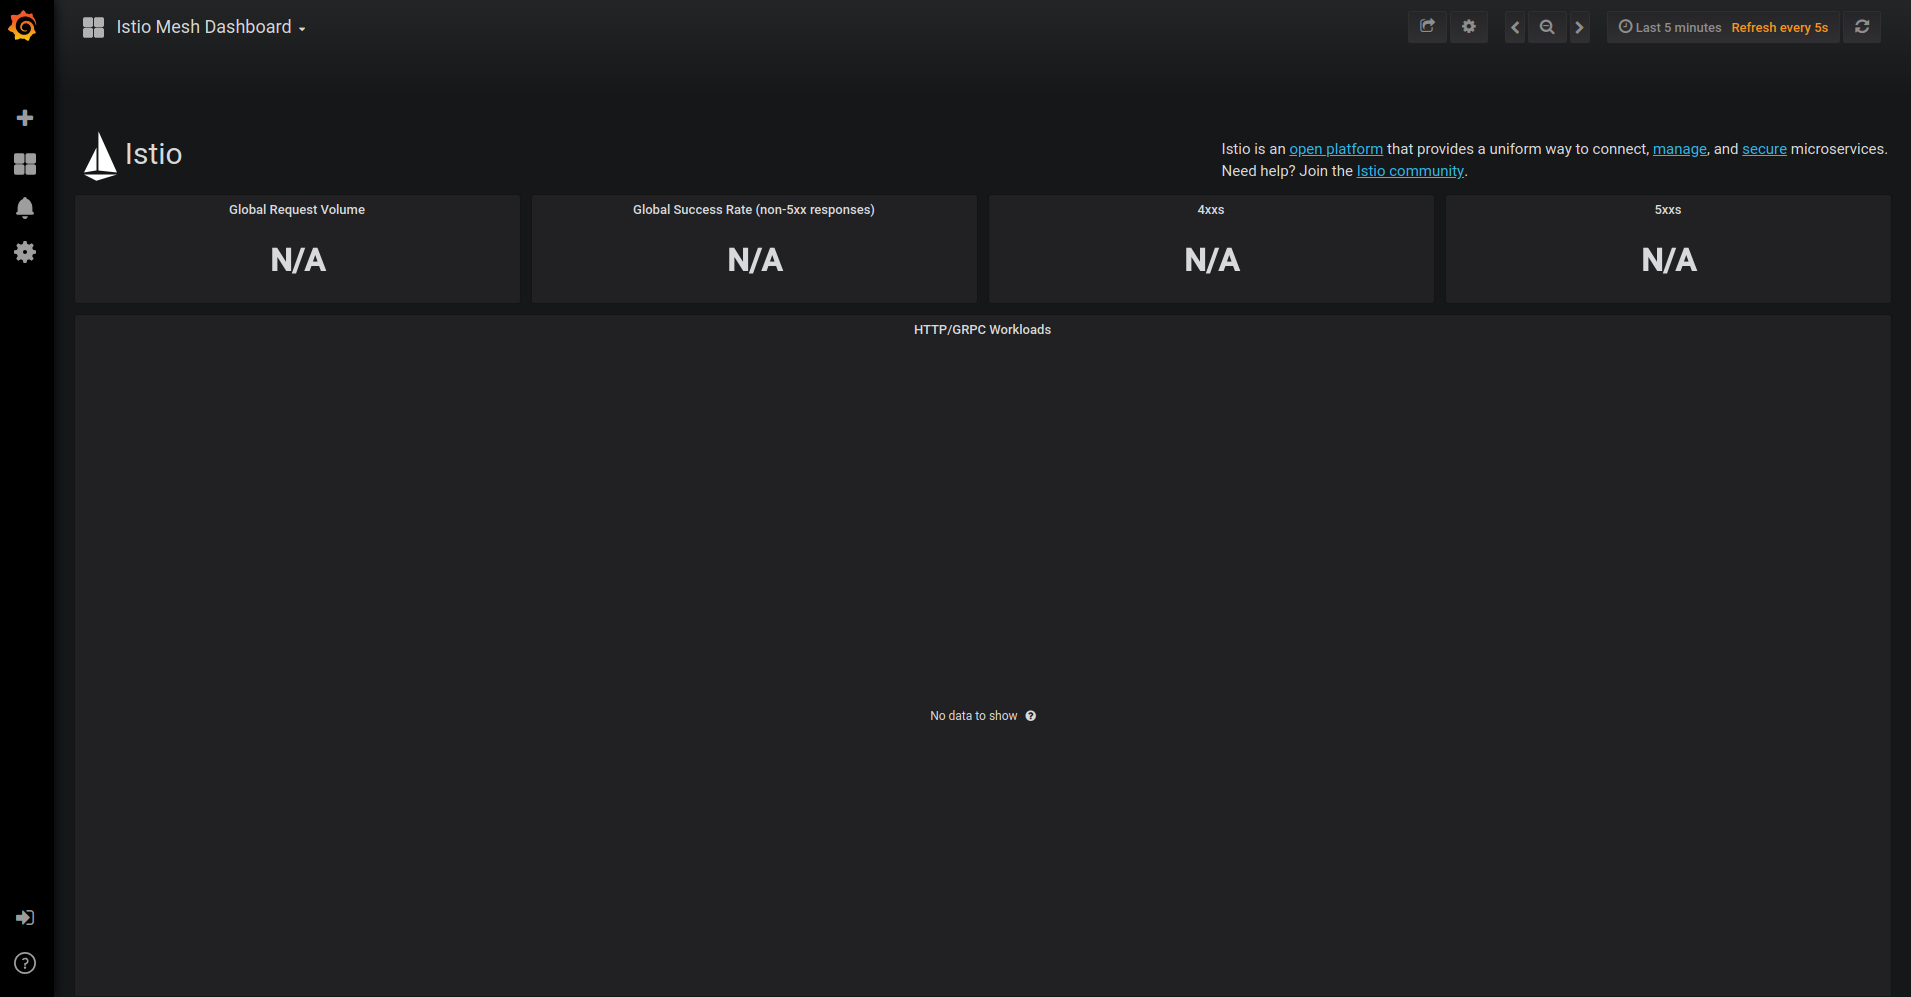
Istio Dashboard Send traffic to the mesh.
For the Bookinfo sample, visit
http://$GATEWAY_URL/productpagein your web browser or issue the following command:To see trace data, you must send requests to your service. The number of requests depends on Istio’s sampling rate. You set this rate when you install Istio. The default sampling rate is 1%. You need to send at least 100 requests before the first trace is visible. To send a 100 requests to the
productpageservice, use the following command:$ for i in $(seq 1 100); do curl -s -o /dev/null "http://$GATEWAY_URL/productpage"; doneRefresh the page a few times (or send the command a few times) to generate a small amount of traffic.
Look at the Istio Dashboard again. It should reflect the traffic that was generated. It will look similar to:
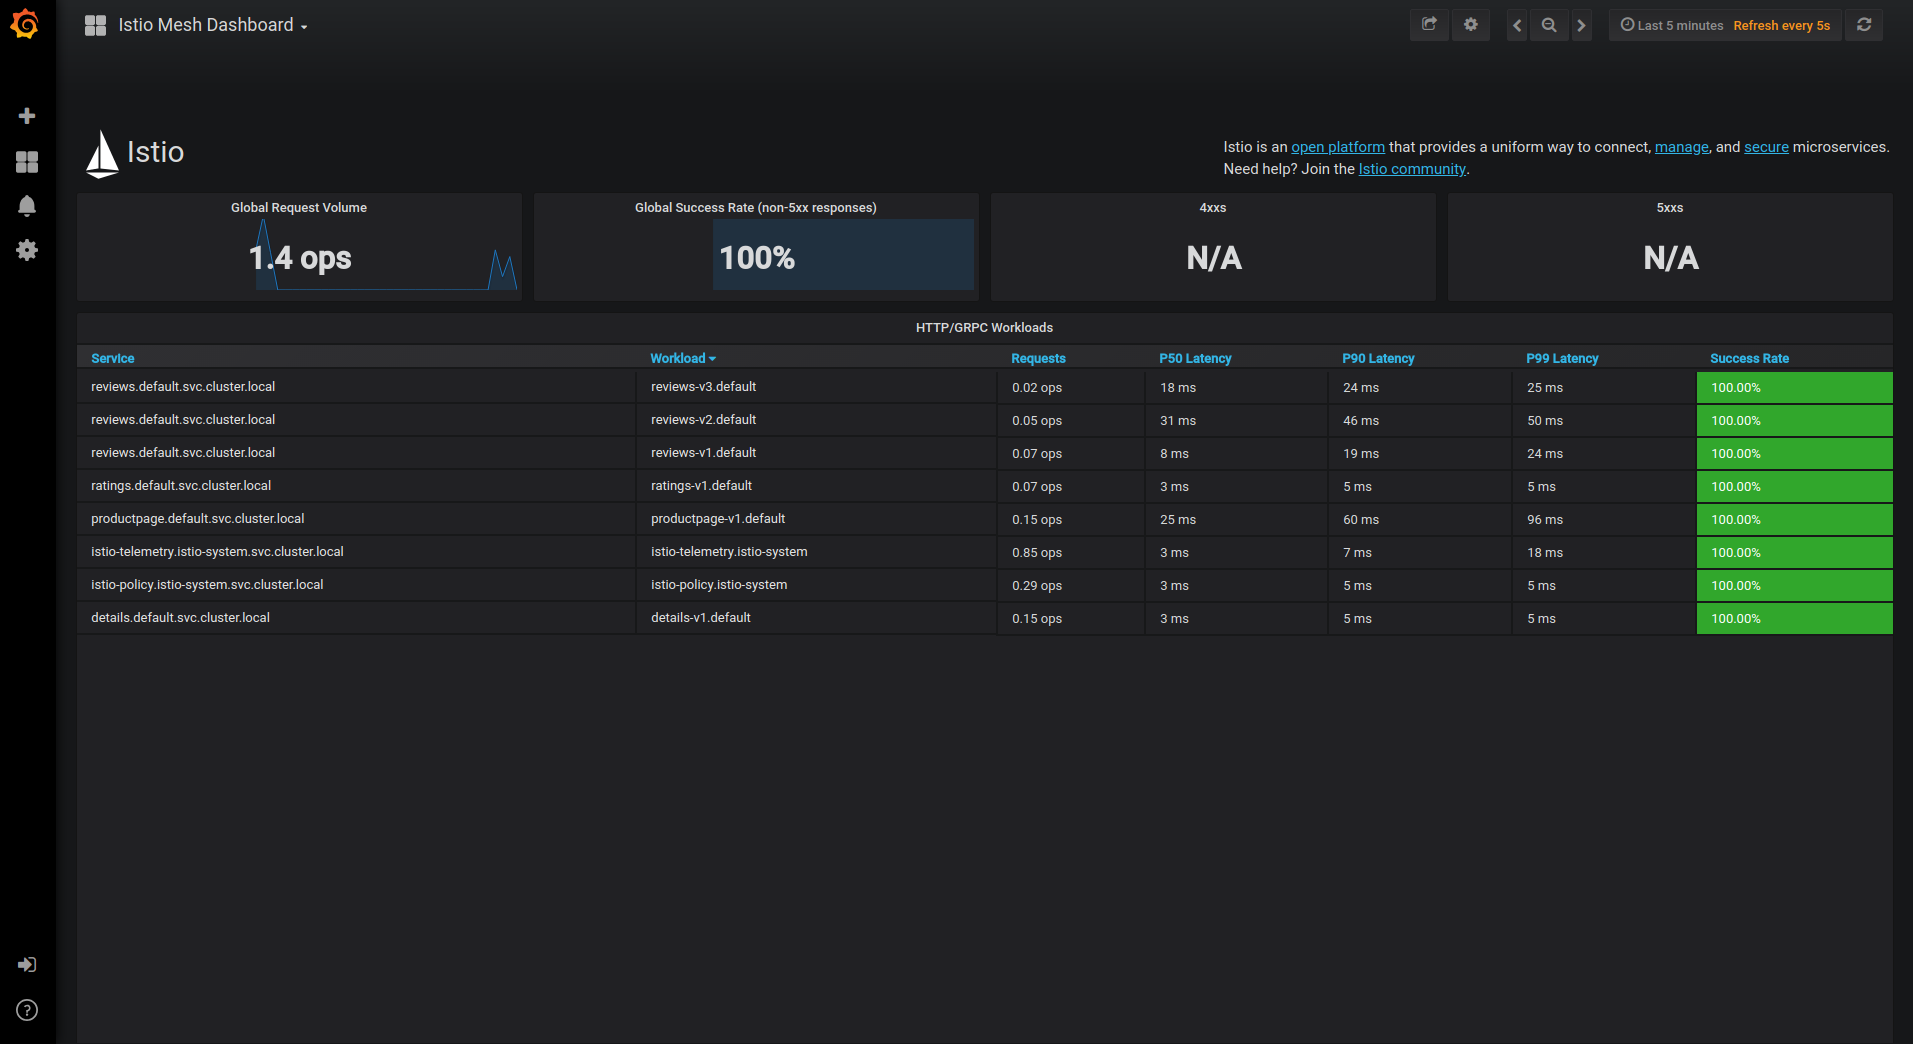
Istio Dashboard With Traffic This gives the global view of the Mesh along with services and workloads in the mesh. You can get more details about services and workloads by navigating to their specific dashboards as explained below.
Visualize Service Dashboards.
From the Grafana dashboard’s left hand corner navigation menu, you can navigate to Istio Service Dashboard or visit http://localhost:3000/d/LJ_uJAvmk/istio-service-dashboard in your web browser.
The Istio Service Dashboard will look similar to:
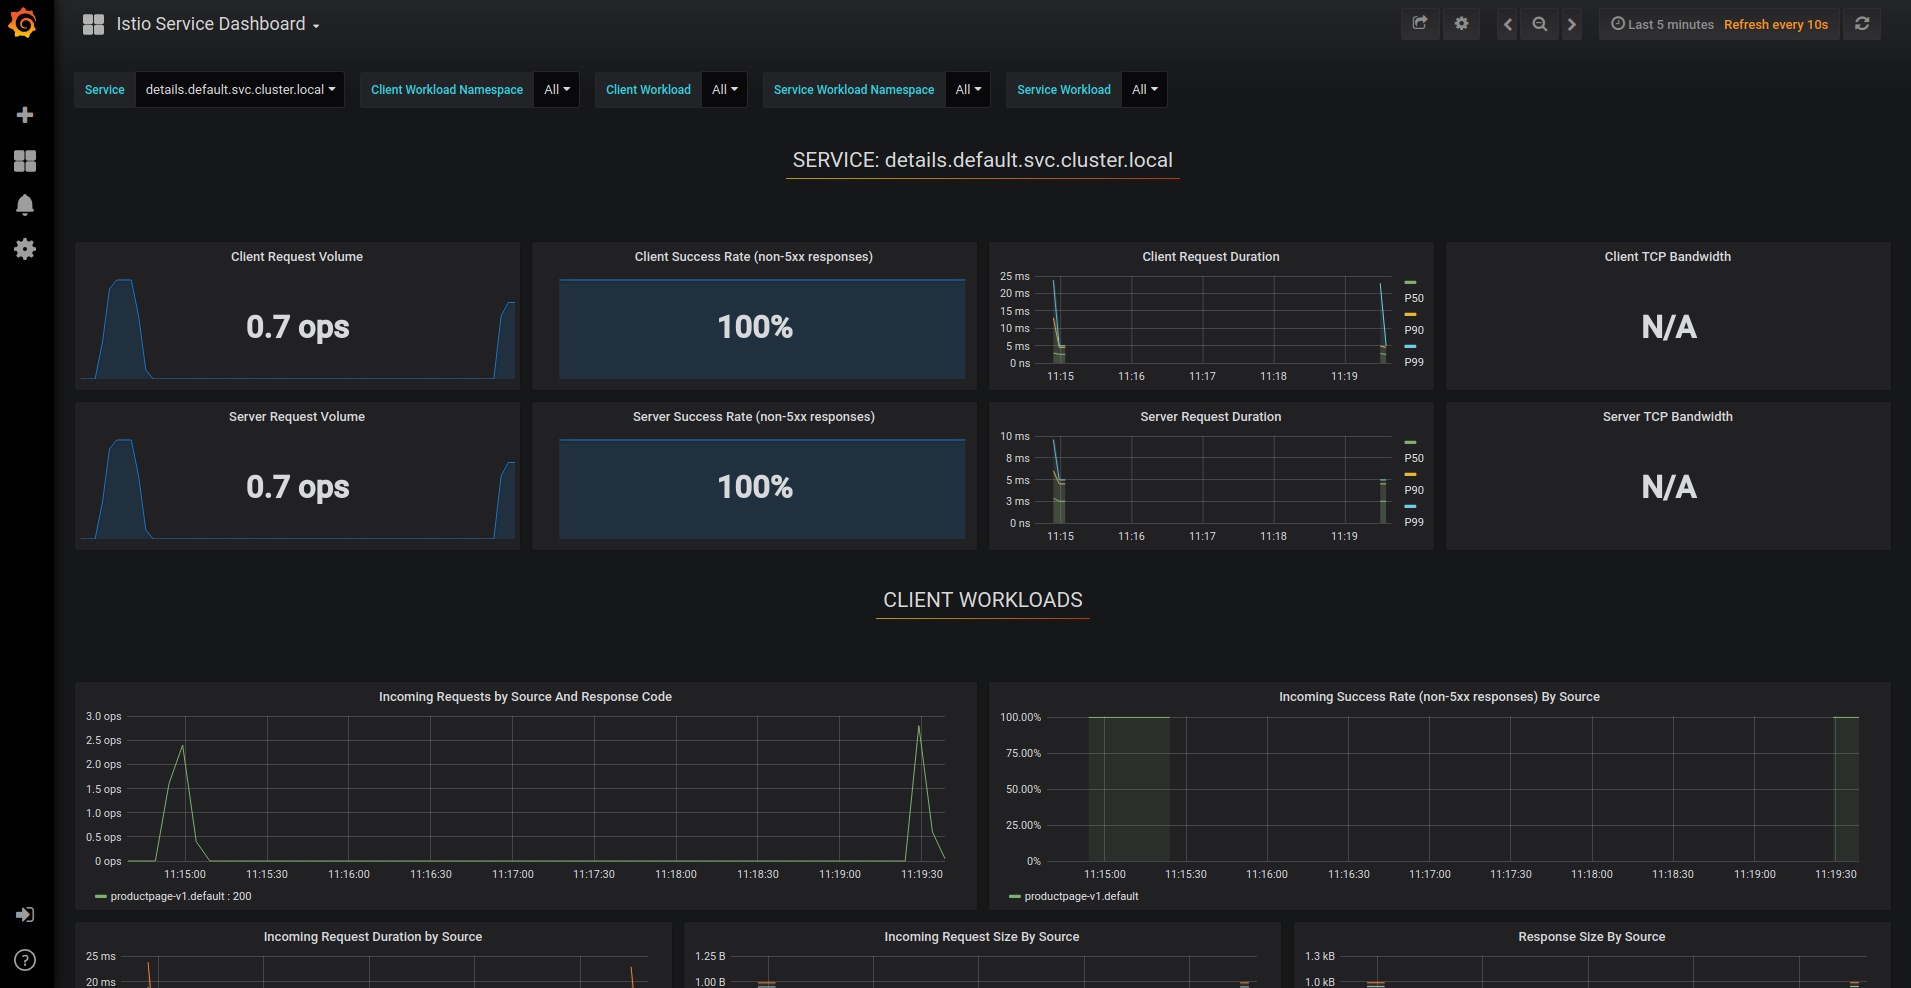
Istio Service Dashboard This gives details about metrics for the service and then client workloads (workloads that are calling this service) and service workloads (workloads that are providing this service) for that service.
Visualize Workload Dashboards.
From the Grafana dashboard’s left hand corner navigation menu, you can navigate to Istio Workload Dashboard or visit http://localhost:3000/d/UbsSZTDik/istio-workload-dashboard in your web browser.
The Istio Workload Dashboard will look similar to:
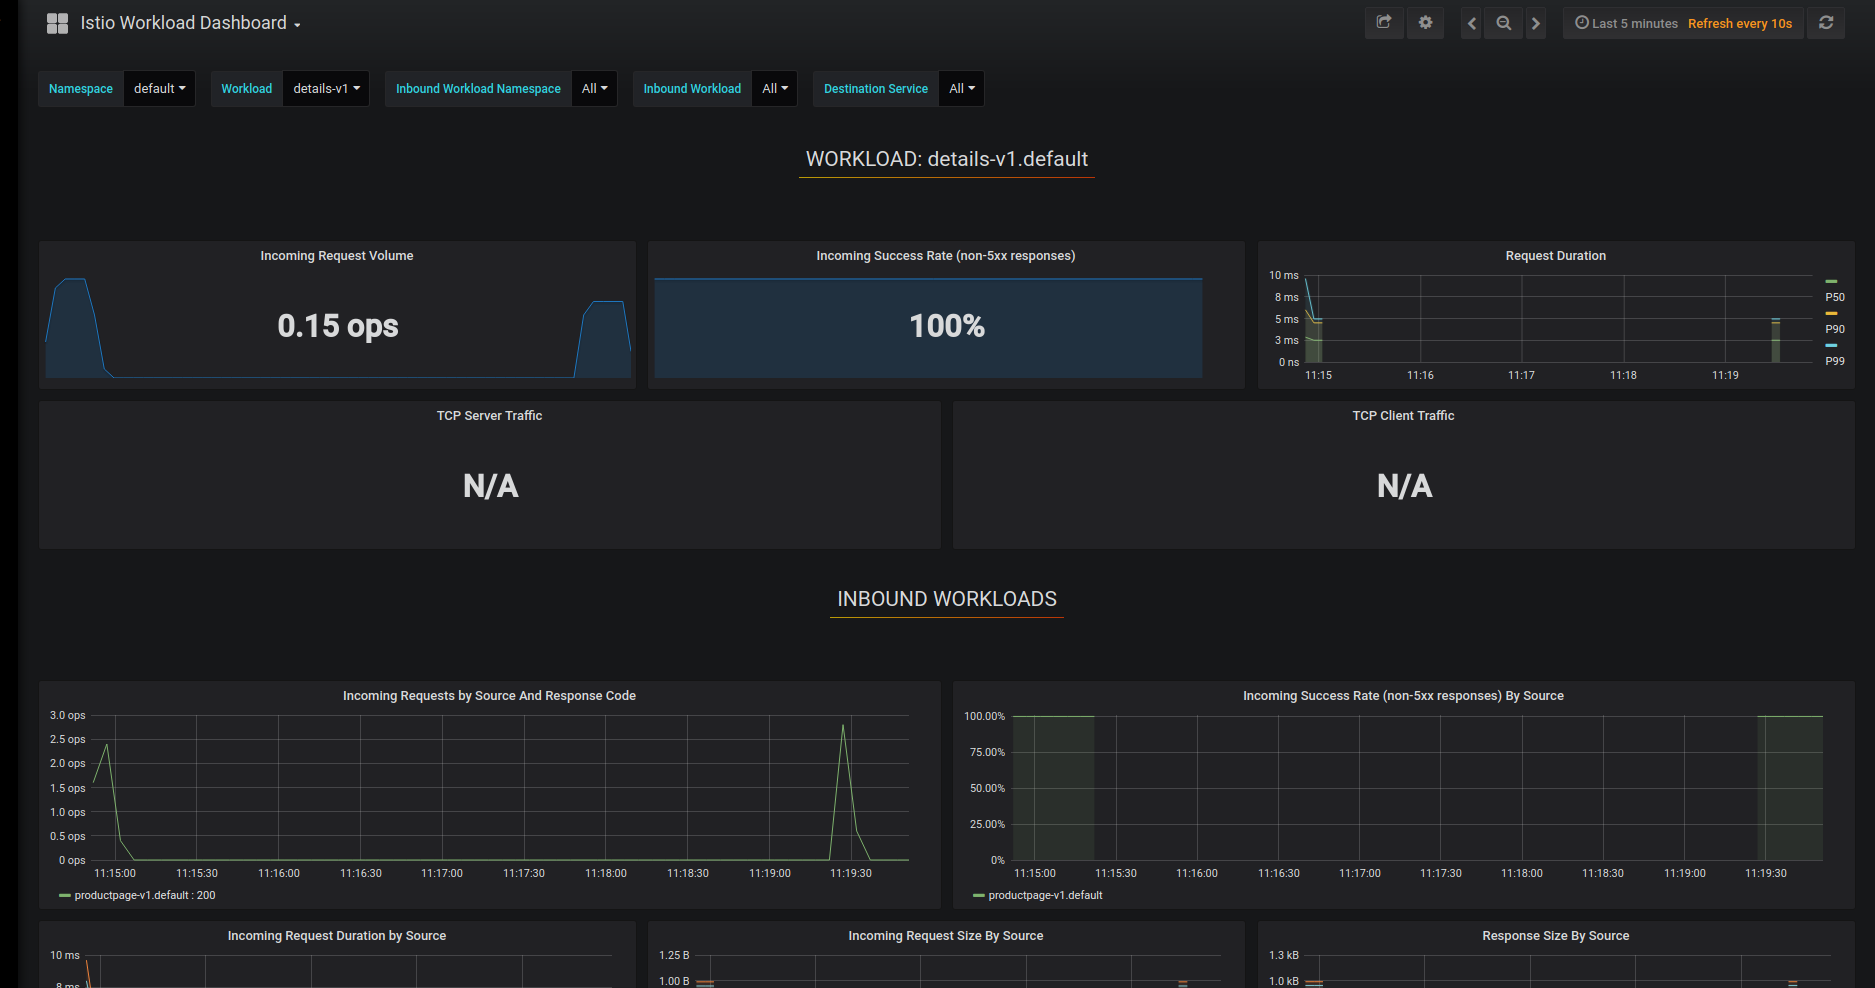
Istio Workload Dashboard This gives details about metrics for each workload and then inbound workloads (workloads that are sending request to this workload) and outbound services (services to which this workload send requests) for that workload.
About the Grafana dashboards
The Istio Dashboard consists of three main sections:
A Mesh Summary View. This section provides Global Summary view of the Mesh and shows HTTP/gRPC and TCP workloads in the Mesh.
Individual Services View. This section provides metrics about requests and responses for each individual service within the mesh (HTTP/gRPC and TCP). This also provides metrics about client and service workloads for this service.
Individual Workloads View: This section provides metrics about requests and responses for each individual workload within the mesh (HTTP/gRPC and TCP). This also provides metrics about inbound workloads and outbound services for this workload.
For more on how to create, configure, and edit dashboards, please see the Grafana documentation.
Cleanup
Remove any
kubectl port-forwardprocesses that may be running:$ killall kubectlIf you are not planning to explore any follow-on tasks, refer to the Bookinfo cleanup instructions to shutdown the application.