Distributed Tracing
This task shows you how Istio-enabled applications can be configured to collect trace spans. After completing this task, you should understand all of the assumptions about your application and how to have it participate in tracing, regardless of what language/framework/platform you use to build your application.
The Bookinfo sample is used as the example application for this task.
Before you begin
Setup Istio by following the instructions in the Installation guide.
Either use the
istio-demo.yamloristio-demo-auth.yamltemplate, which includes tracing support, or use the Helm chart with tracing enabled by setting the--set tracing.enabled=trueoption.Deploy the Bookinfo sample application.
Accessing the dashboard
Setup access to the Jaeger dashboard by using port-forwarding:
$ kubectl port-forward -n istio-system $(kubectl get pod -n istio-system -l app=jaeger -o jsonpath='{.items[0].metadata.name}') 16686:16686 &Access the Jaeger dashboard by opening your browser to http://localhost:16686.
Generating traces using the Bookinfo sample
With the Bookinfo application up and running, generate trace information by accessing
http://$GATEWAY_URL/productpage one or more times.
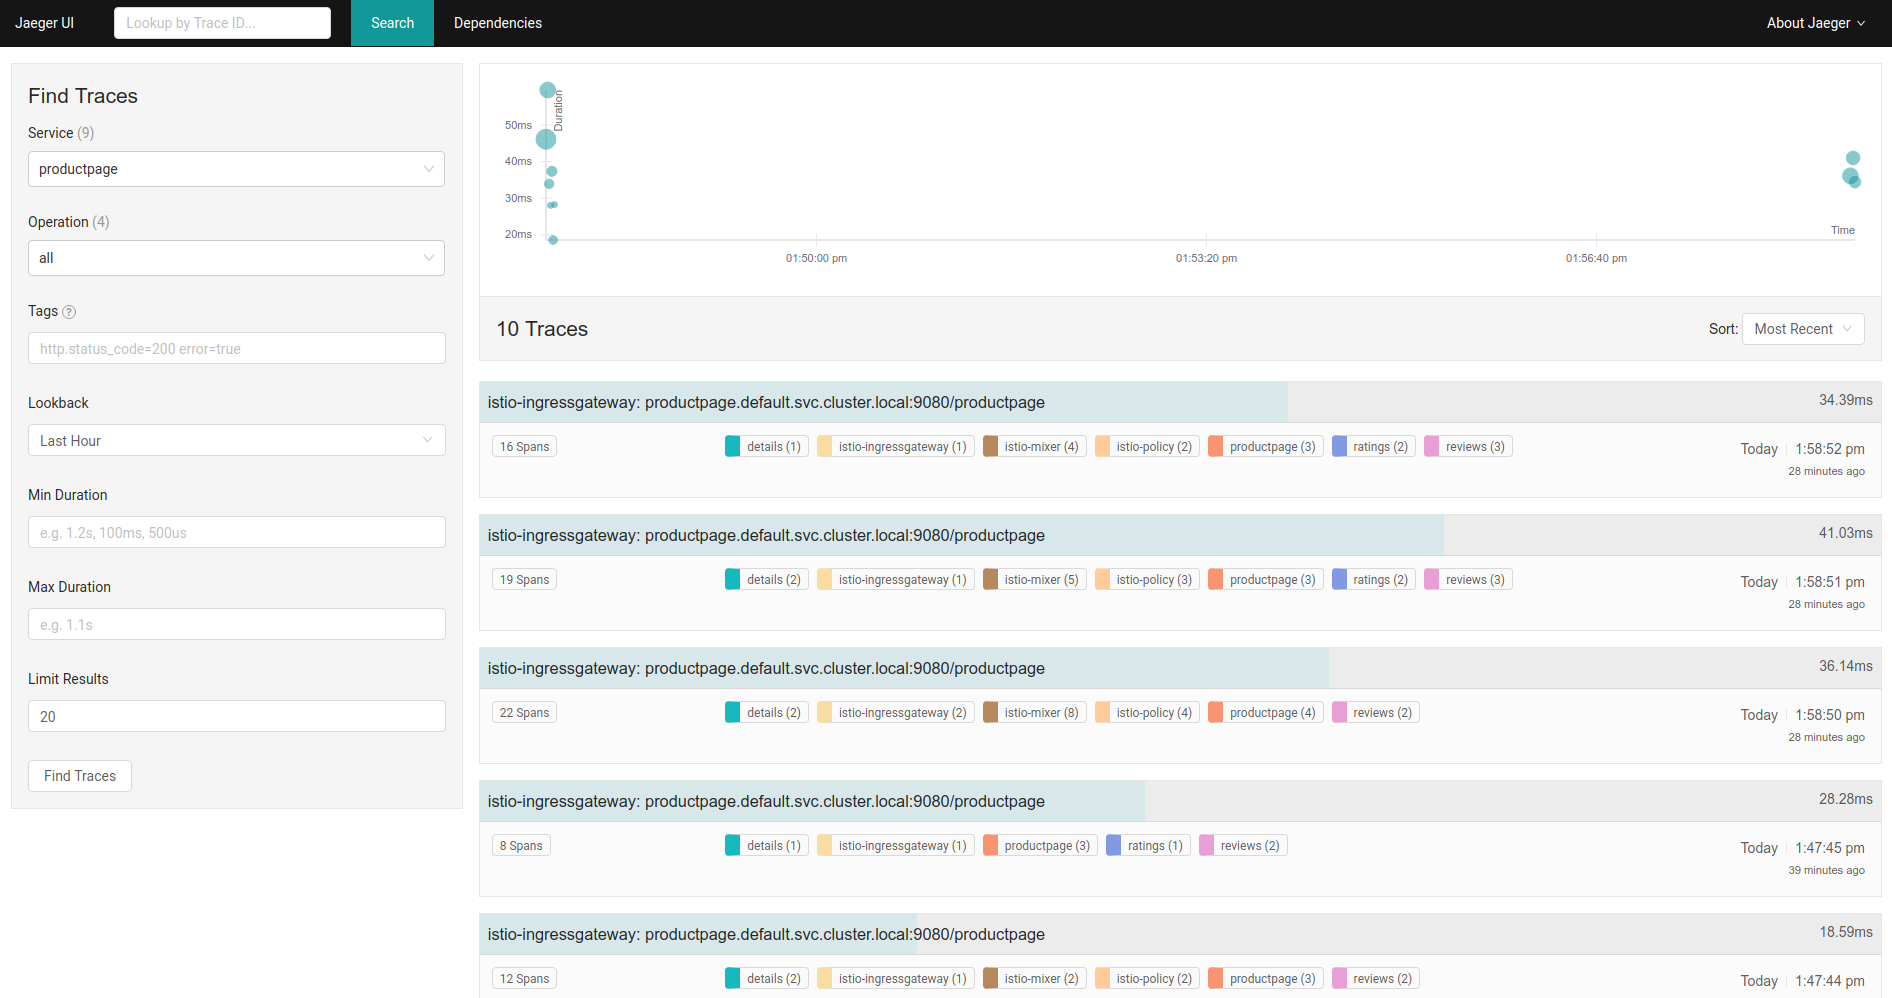
From the left-hand pane of the Jaeger dashboard, select productpage from the Service drop-down list and click
Find Traces. You should see something similar to the following:
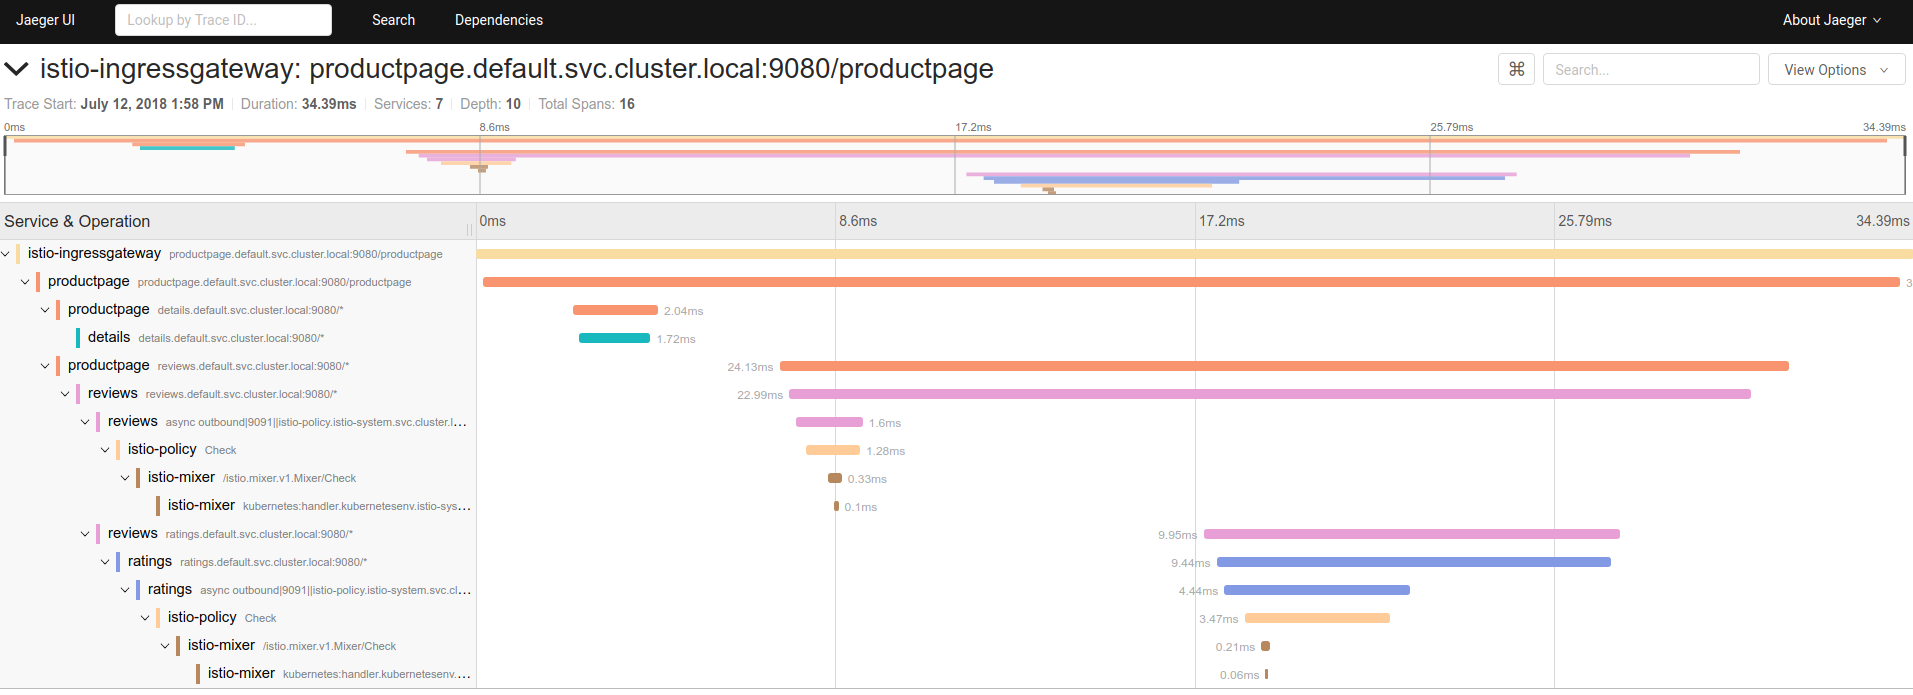
If you click on the top (most recent) trace, you should see the details corresponding to your
latest refresh of the /productpage.
The page should look something like this:
As you can see, the trace is comprised of a set of spans,
where each span corresponds to a Bookinfo service invoked during the execution of a /productpage request.
Every RPC is represented by two spans in the trace. For example, the call from productpage to reviews starts
with the span labeled productpage reviews.default.svc.cluster.local:9080/, which represents the client-side
span for the call. It took 24.13ms . The second span (labeled reviews reviews.default.svc.cluster.local:9080/)
is a child of the first span and represents the server-side span for the call. It took 22.99ms .
The trace for the call to the reviews services reveals two subsequent RPC's in the trace. The first is to the istio-policy
service, reflecting the server-side Check call made for the service to authorize access. The second is the call out to
the ratings service.
Understanding what happened
Although Istio proxies are able to automatically send spans, they need some hints to tie together the entire trace. Applications need to propagate the appropriate HTTP headers so that when the proxies send span information, the spans can be correlated correctly into a single trace.
To do this, an application needs to collect and propagate the following headers from the incoming request to any outgoing requests:
x-request-idx-b3-traceidx-b3-spanidx-b3-parentspanidx-b3-sampledx-b3-flagsx-ot-span-context
If you look in the sample services, you can see that the productpage service (Python) extracts the required headers from an HTTP request:
def getForwardHeaders(request):
    headers = {}

    if 'user' in session:
        headers['end-user'] = session['user']

    incoming_headers = [ 'x-request-id',
                         'x-b3-traceid',
                         'x-b3-spanid',
                         'x-b3-parentspanid',
                         'x-b3-sampled',
                         'x-b3-flags',
                         'x-ot-span-context'
    ]

    for ihdr in incoming_headers:
        val = request.headers.get(ihdr)
        if val is not None:
            headers[ihdr] = val
            #print "incoming: "+ihdr+":"+val

    return headers
The reviews application (Java) does something similar:
@GET
@Path("/reviews/{productId}")
public Response bookReviewsById(@PathParam("productId") int productId,
                            @HeaderParam("end-user") String user,
                            @HeaderParam("x-request-id") String xreq,
                            @HeaderParam("x-b3-traceid") String xtraceid,
                            @HeaderParam("x-b3-spanid") String xspanid,
                            @HeaderParam("x-b3-parentspanid") String xparentspanid,
                            @HeaderParam("x-b3-sampled") String xsampled,
                            @HeaderParam("x-b3-flags") String xflags,
                            @HeaderParam("x-ot-span-context") String xotspan) {
  int starsReviewer1 = -1;
  int starsReviewer2 = -1;

  if (ratings_enabled) {
    JsonObject ratingsResponse = getRatings(Integer.toString(productId), user, xreq, xtraceid, xspanid, xparentspanid, xsampled, xflags, xotspan);
When you make downstream calls in your applications, make sure to include these headers.
Trace sampling
When using the demo configuration (as in this task), Istio captures a trace for all requests.
For example, when using the Bookinfo sample application above, every time you access
/productpage you see a corresponding trace in the Jaeger dashboard. This sampling
rate is suitable for a test or low traffic mesh, which is why it is used as the default for
the demo installs.
In other configurations, Istio defaults to generating trace spans for 1 out of every 100 requests (sampling rate of of 1%).
You can control the trace sampling percentage in one of two ways:
During the mesh setup, use the Helm option
pilot.traceSamplingto set the percentage of trace sampling. See the Helm Install documentation for details on setting options.In a running mesh, edit the
istio-pilotdeployment and change the environment variable with the following steps:To open your text editor with the deployment configuration file loaded, run the following command:
$ kubectl -n istio-system edit deploy istio-pilotFind the
PILOT_TRACE_SAMPLINGenvironment variable, and change thevalue:to your desired percentage.
In both cases, valid values are from 0.0 to 100.0 with a precision of 0.01.
Cleanup
Remove any
kubectl port-forwardprocesses that may still be running:$ killall kubectlIf you are not planning to explore any follow-on tasks, refer to the Bookinfo cleanup instructions to shutdown the application.
See also
Demonstrates how to obtain uniform metrics, logs, traces across different services using Istio Mixer and Istio sidecar.
Improving availability and reducing latency.
Provides an overview of Mixer's plug-in architecture.
This task shows you how to configure Istio to collect metrics and logs.
Collecting Metrics for TCP services
This task shows you how to configure Istio to collect metrics for TCP services.
This task shows you how to generate a graph of services within an Istio mesh.

