Visualizing Your Mesh
This task shows you how to visualize different aspects of your Istio mesh.
As part of this task, you install the Kiali addon and use the web-based graphical user interface to view service graphs of the mesh and your Istio configuration objects.
This task uses the Bookinfo sample application as the example throughout. This task
assumes the Bookinfo application is installed in the bookinfo namespace.
Before you begin
Follow the Kiali installation documentation to deploy Kiali into your cluster.
Generating a graph
To verify the service is running in your cluster, run the following command:
$ kubectl -n istio-system get svc kialiTo determine the Bookinfo URL, follow the instructions to determine the Bookinfo ingress
GATEWAY_URL.To send traffic to the mesh, you have three options
Visit
http://$GATEWAY_URL/productpagein your web browserUse the following command multiple times:
$ curl http://$GATEWAY_URL/productpageIf you installed the
watchcommand in your system, send requests continually with:$ watch -n 1 curl -o /dev/null -s -w %{http_code} $GATEWAY_URL/productpage
To open the Kiali UI, execute the following command in your Kubernetes environment:
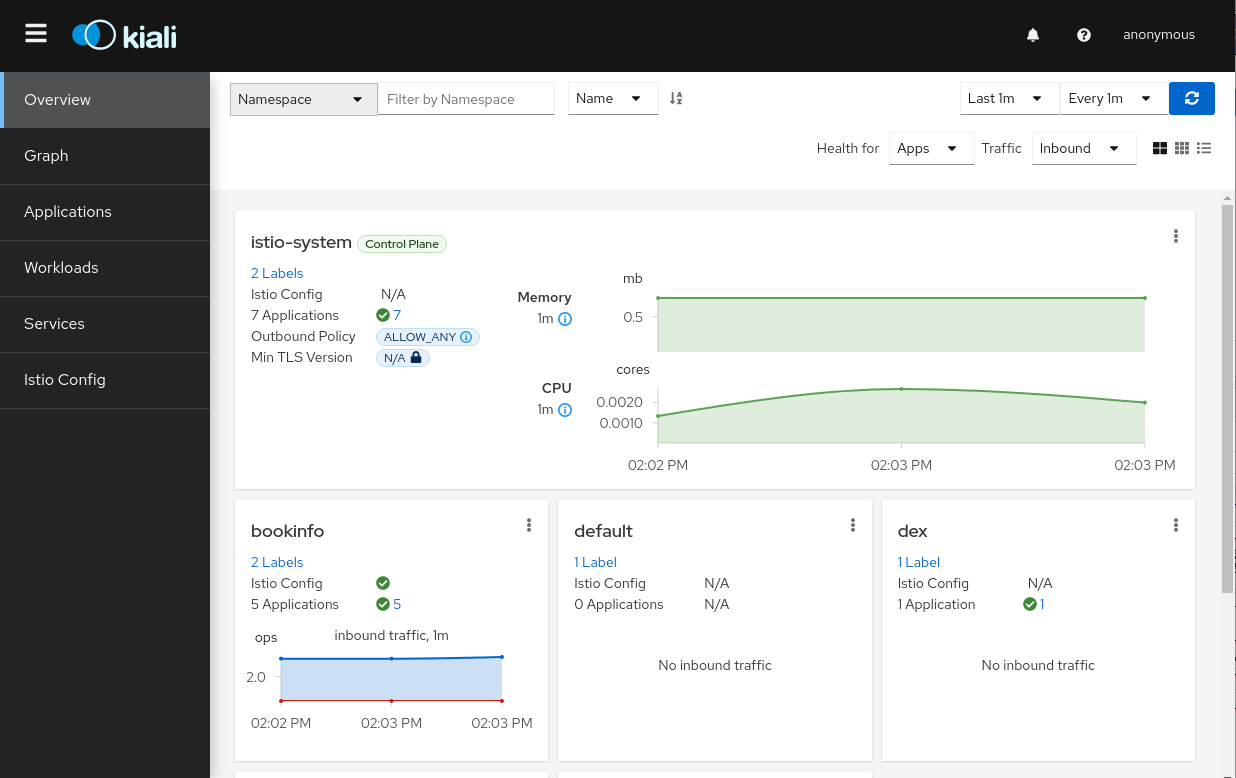
$ istioctl dashboard kialiView the overview of your mesh in the Overview page that appears immediately after you log in. The Overview page displays all the namespaces that have services in your mesh. The following screenshot shows a similar page:
Example Overview To view a namespace graph, Select the
Graphoption in the kebab menu of the Bookinfo overview card. The kebab menu is at the top right of card and looks like 3 vertical dots. Click it to see the available options. The page looks similar to: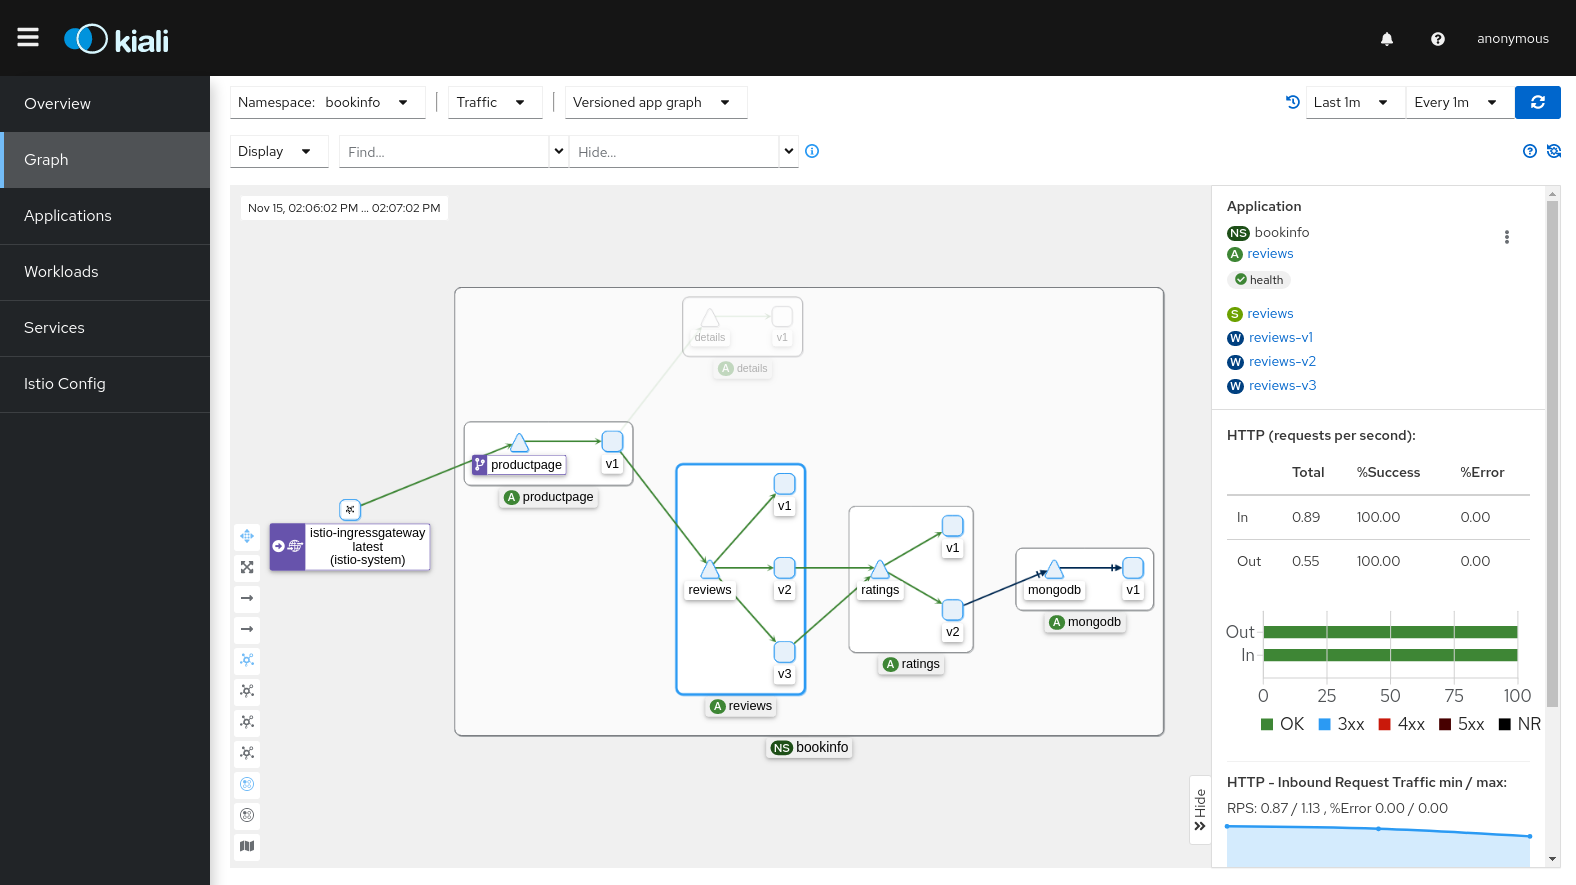
Example Graph The graph represents traffic flowing through the service mesh for a period of time. It is generated using Istio telemetry.
To view a summary of metrics, select any node or edge in the graph to display its metric details in the summary details panel on the right.
To view your service mesh using different graph types, select a graph type from the Graph Type drop down menu. There are several graph types to choose from: App, Versioned App, Workload, Service.
The App graph type aggregates all versions of an app into a single graph node. The following example shows a single reviews node representing the three versions of the reviews app. Note that the
Show Service NodesDisplay option has been disabled.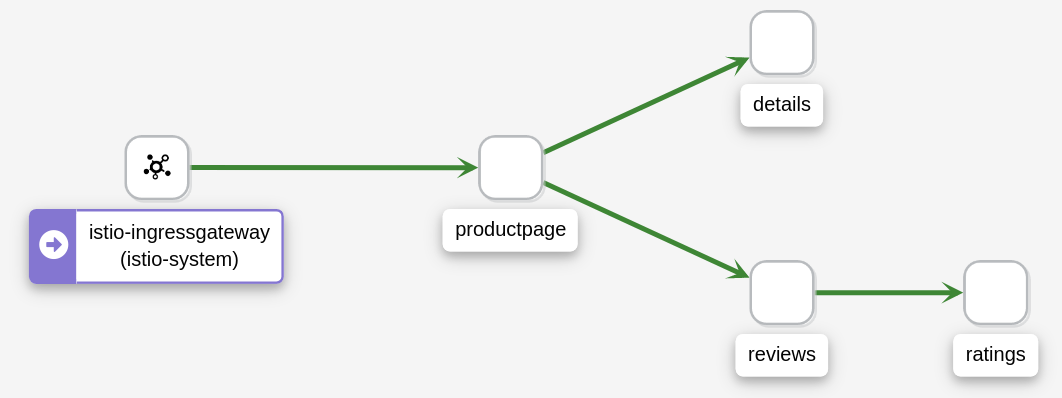
Example App Graph The Versioned App graph type shows a node for each version of an app, but all versions of a particular app are grouped together. The following example shows the reviews group box that contains the three nodes that represents the three versions of the reviews app.
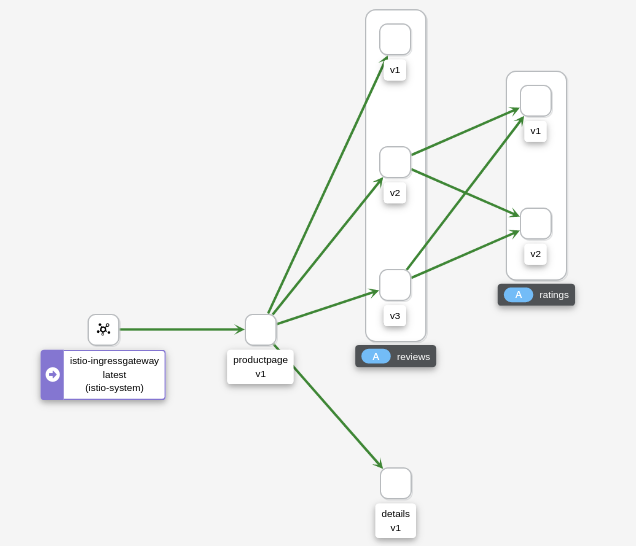
Example Versioned App Graph The Workload graph type shows a node for each workload in your service mesh. This graph type does not require you to use the
appandversionlabels so if you opt to not use those labels on your components, this may be your graph type of choice.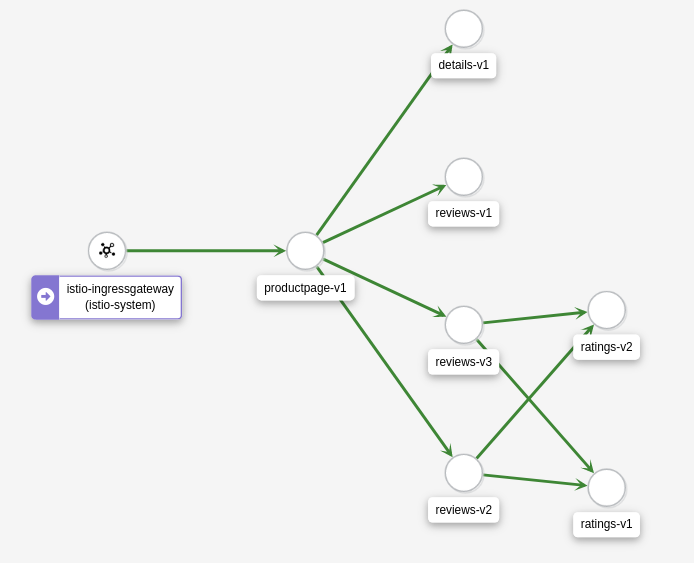
Example Workload Graph The Service graph type shows a high-level aggregation of service traffic in your mesh.
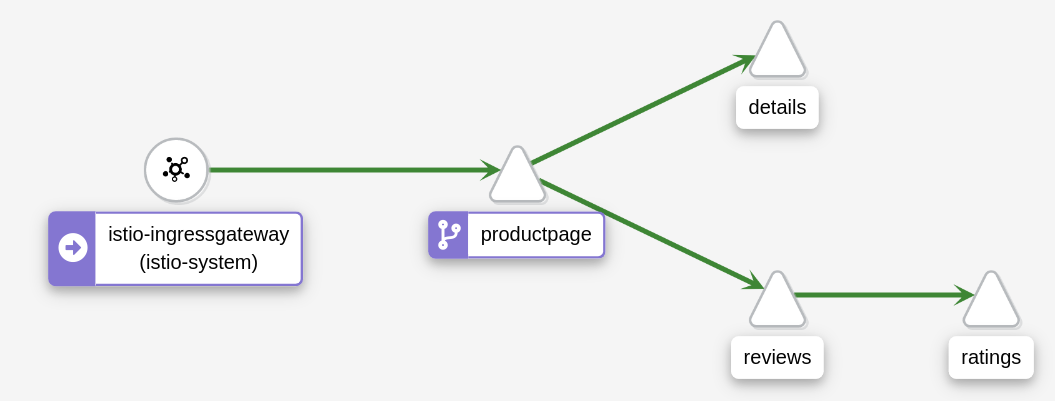
Example Service Graph
Examining Istio configuration
The left menu options lead to list views for Applications, Workloads, Services and Istio Config. The following screenshot shows Services information for the Bookinfo namespace:
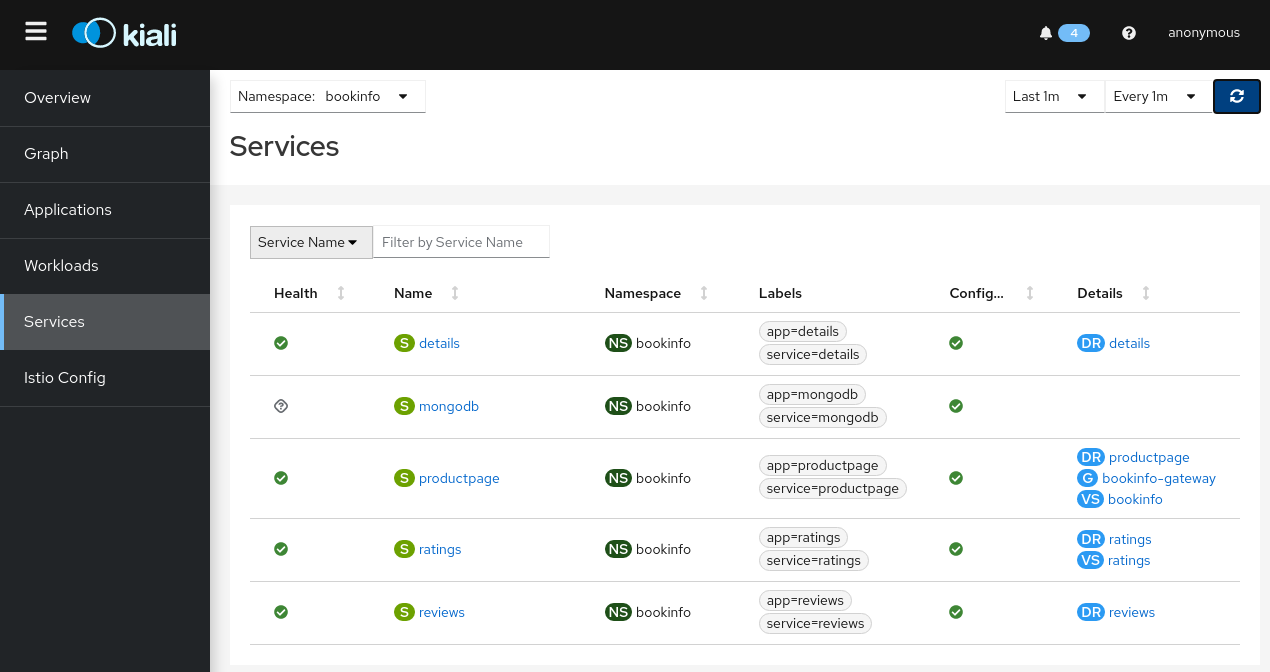
Example Details
Traffic Shifting
You can use the Kiali traffic shifting wizard to define the specific percentage of request traffic to route to two or more workloads.
View the Versioned app graph of the
bookinfograph.Make sure you have enabled the Traffic Distribution Edge Label Display option to see the percentage of traffic routed to each workload.
Make sure you have enabled the Show Service Nodes Display option to view the service nodes in the graph.
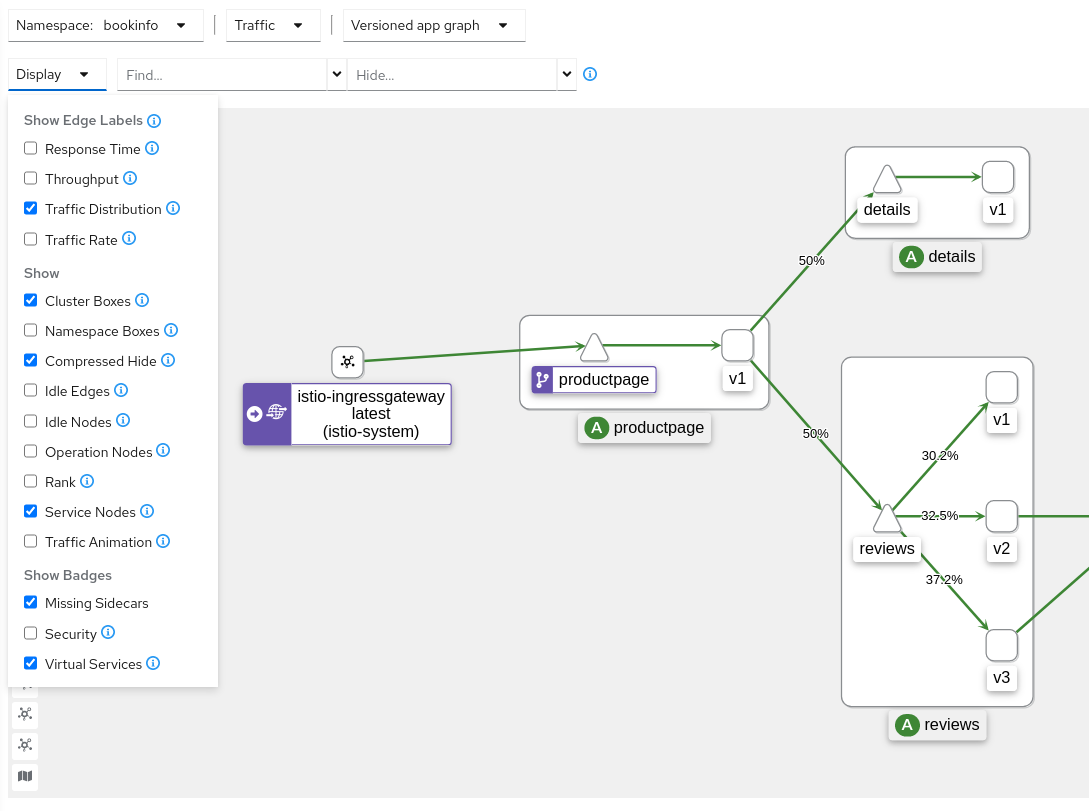
Bookinfo Graph Options Focus on the
ratingsservice within thebookinfograph by clicking on theratingsservice (triangle) node. Notice theratingsservice traffic is evenly distributed to the tworatingsworkloadsv1andv2(50% of requests are routed to each workload).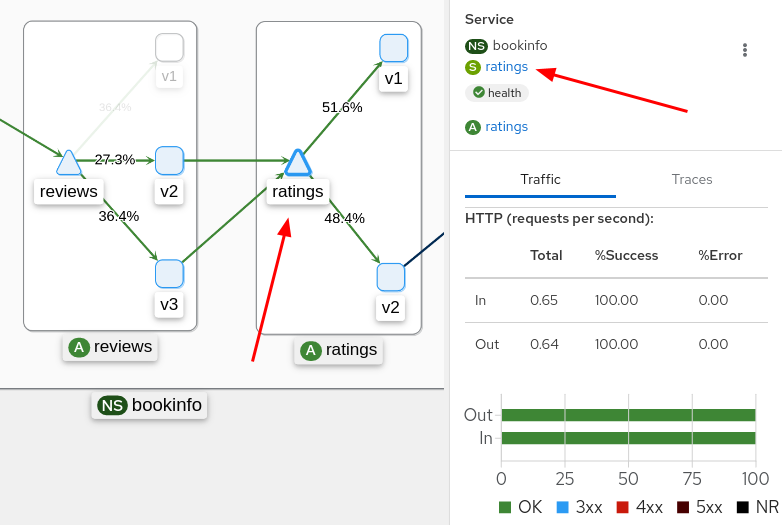
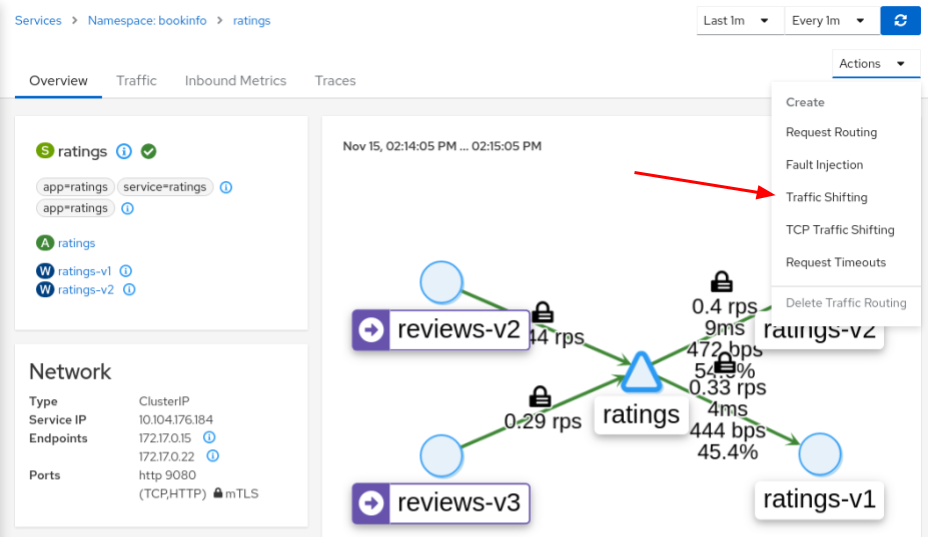
Graph Showing Percentage of Traffic Click the ratings link found in the side panel to go to the detail view for the
ratingsservice. This could also be done by secondary-click on theratingsservice node, and selectingDetailsfrom the context menu.From the Actions drop down menu, select Traffic Shifting to access the traffic shifting wizard.
Service Actions Menu Drag the sliders to specify the percentage of traffic to route to each workload. For
ratings-v1, set it to 10%; forratings-v2set it to 90%.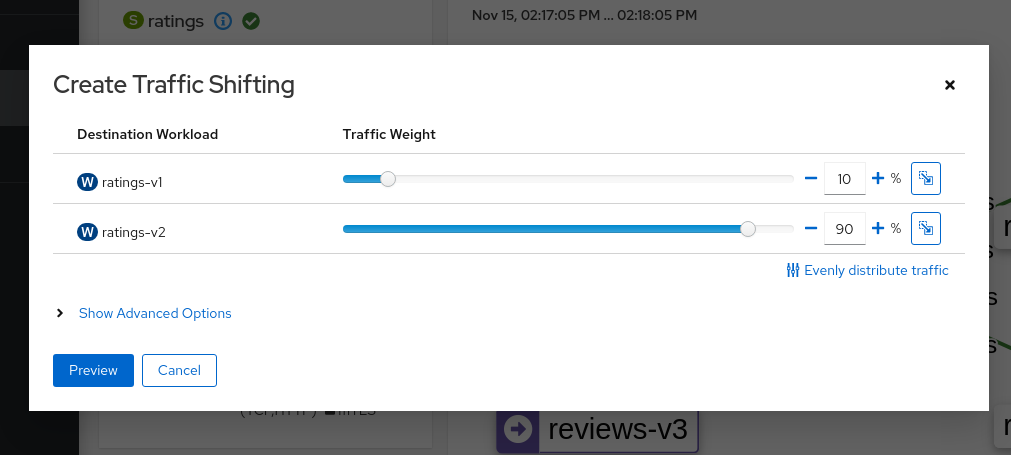
Weighted Routing Wizard Click the Preview button to view the YAML that will be generated by the wizard.
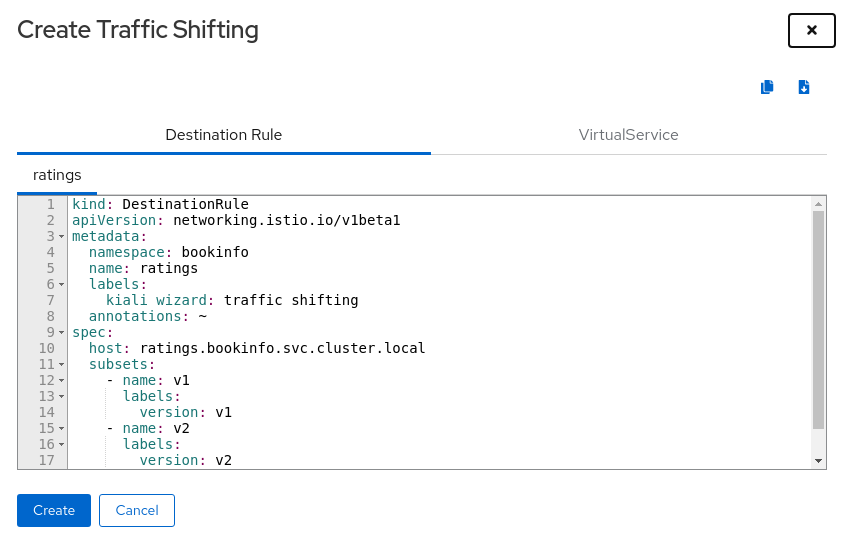
Routing Wizard Preview Click the Create button and confirm to apply the new traffic settings.
Click Graph in the left hand navigation bar to return to the
bookinfograph. Notice that theratingsservice node is now badged with thevirtual serviceicon.Send requests to the
bookinfoapplication. For example, to send one request per second, you can execute this command if you havewatchinstalled on your system:$ watch -n 1 curl -o /dev/null -s -w %{http_code} $GATEWAY_URL/productpageAfter a few minutes you will notice that the traffic percentage will reflect the new traffic route, thus confirming the fact that your new traffic route is successfully routing 90% of all traffic requests to
ratings-v2.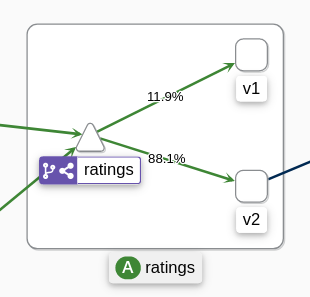
90% Ratings Traffic Routed to ratings-v2
Validating Istio configuration
Kiali can validate your Istio resources to ensure they follow proper conventions and semantics. Any problems detected in the configuration of your Istio resources can be flagged as errors or warnings depending on the severity of the incorrect configuration. See the Kiali validations page for the list of all validation checks Kiali performs.
Force an invalid configuration of a service port name to see how Kiali reports a validation error.
Change the port name of the
detailsservice fromhttptofoo:$ kubectl patch service details -n bookinfo --type json -p '[{"op":"replace","path":"/spec/ports/0/name", "value":"foo"}]'Navigate to the Services list by clicking Services on the left hand navigation bar.
Select
bookinfofrom the Namespace drop down menu if it is not already selected.Notice the error icon displayed in the Configuration column of the
detailsrow.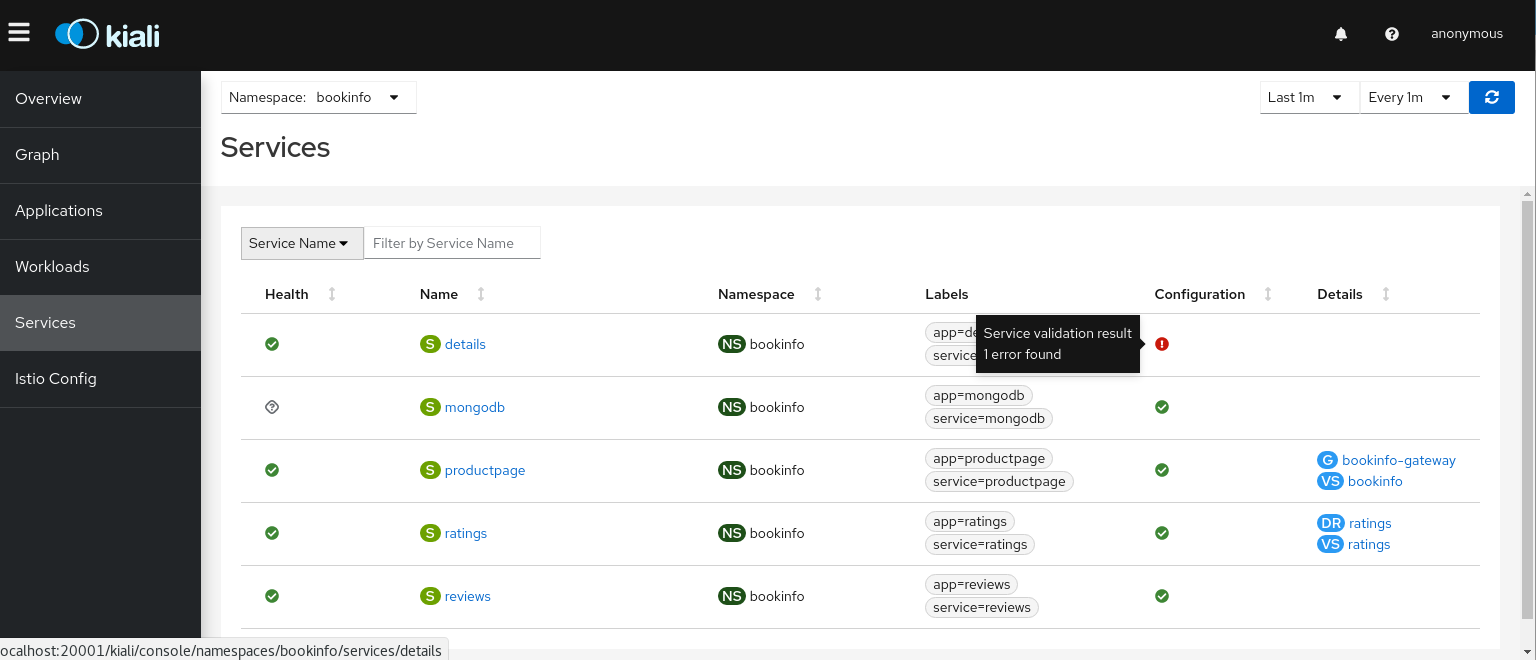
Services List Showing Invalid Configuration Click the details link in the Name column to navigate to the service details view.
Hover over the error icon to display a tool tip describing the error.
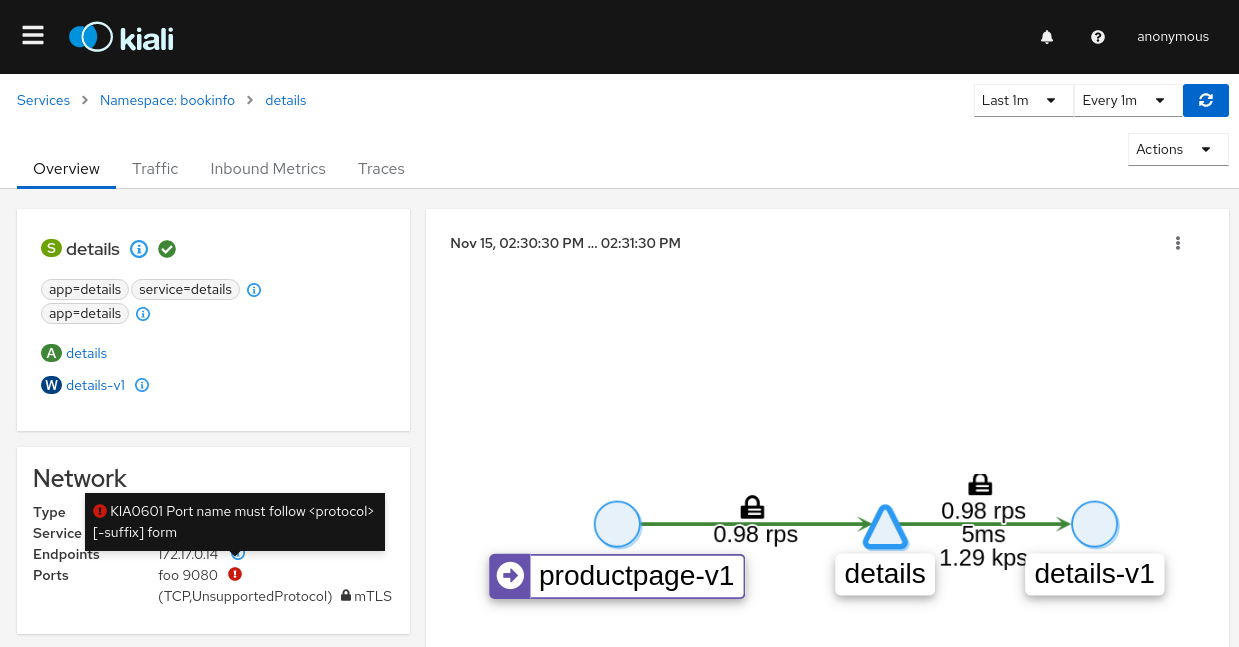
Service Details Describing the Invalid Configuration Change the port name back to
httpto correct the configuration and returnbookinfoback to its normal state.$ kubectl patch service details -n bookinfo --type json -p '[{"op":"replace","path":"/spec/ports/0/name", "value":"http"}]'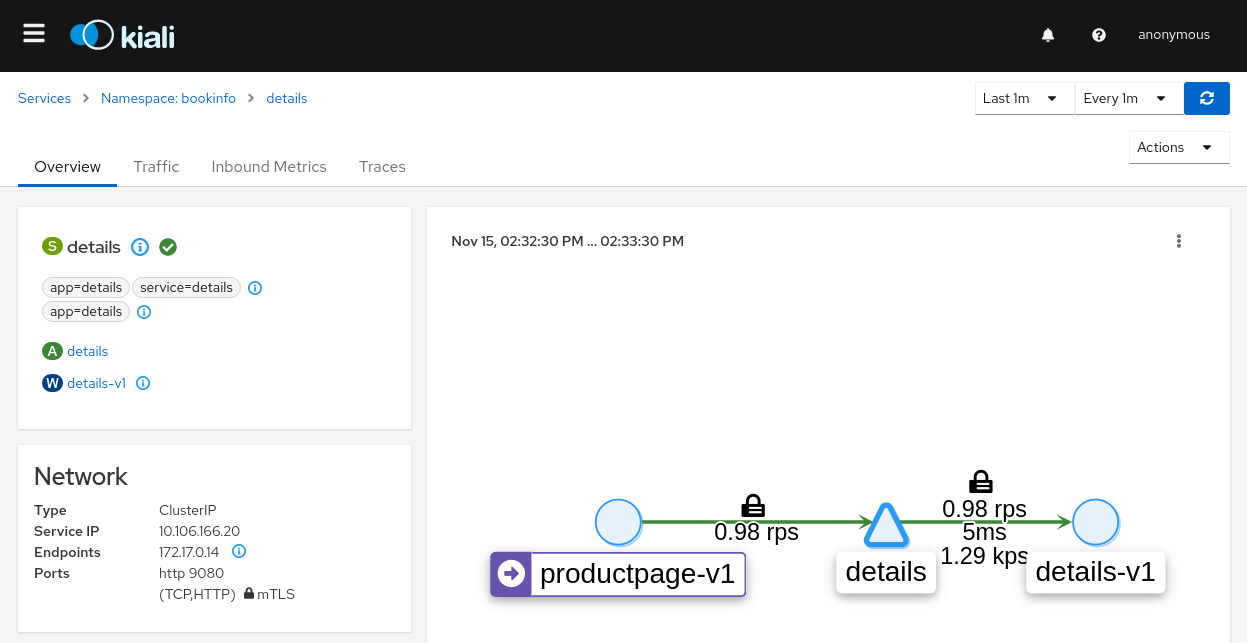
Service Details Showing Valid Configuration
Viewing and editing Istio configuration YAML
Kiali provides a YAML editor for viewing and editing Istio configuration resources. The YAML editor will also provide validation messages when it detects incorrect configurations.
Introduce an error in the
bookinfoVirtualService$ kubectl patch vs bookinfo -n bookinfo --type json -p '[{"op":"replace","path":"/spec/gateways/0", "value":"bookinfo-gateway-invalid"}]'Click
Istio Configon the left hand navigation bar to navigate to the Istio configuration list.Select
bookinfofrom the Namespace drop down menu if it is not already selected.Notice the error icon that alerts you to a configuration problem.
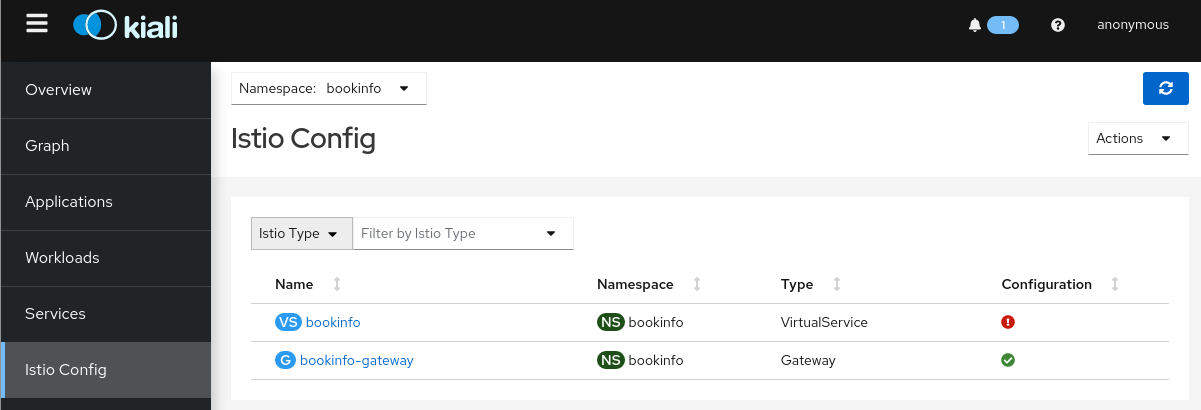
Istio Config List Incorrect Configuration Click the error icon in the Configuration column of the
bookinforow to navigate to thebookinfovirtual service view.The YAML tab is preselected. Notice the color highlights and icons on the rows that have validation check notifications associated with them.
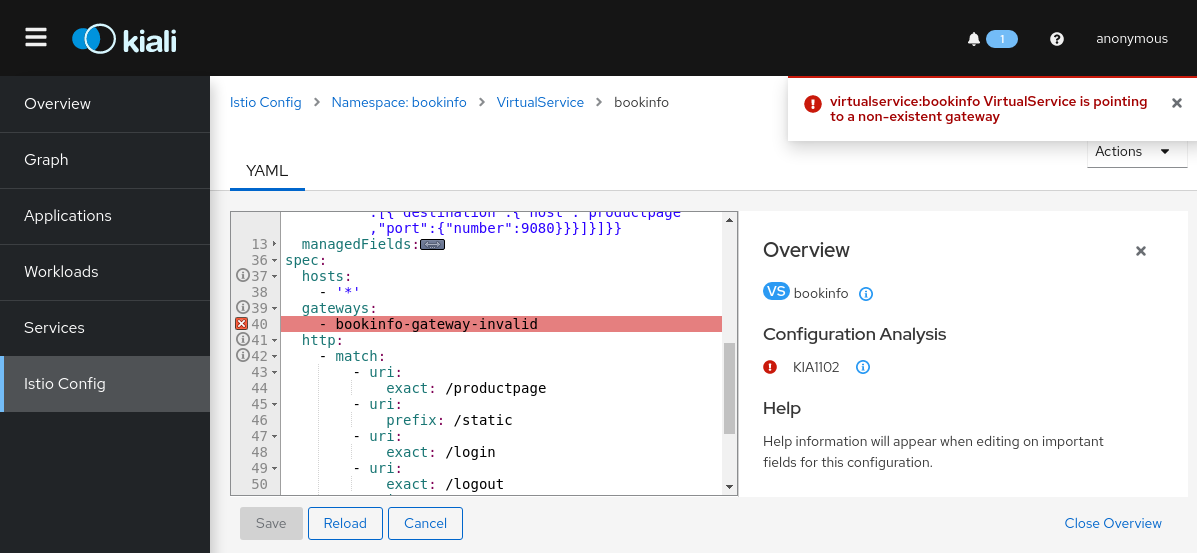
YAML Editor Showing Validation Notifications Hover over the red icon to view the tool tip message that informs you of the validation check that triggered the error. For more details on the cause of the error and how to resolve it, look up the validation error message on the Kiali Validations page.
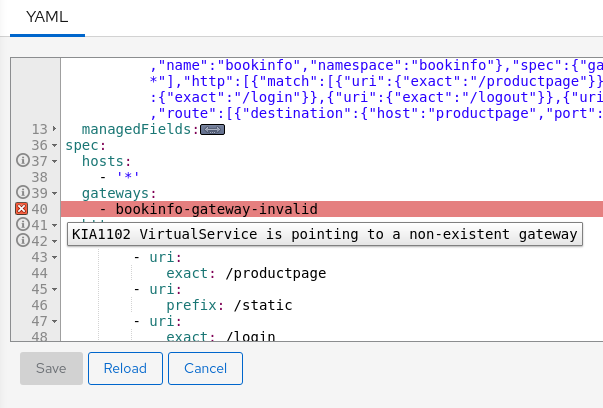
YAML Editor Showing Error Tool Tip Reset the virtual service
bookinfoback to its original state.$ kubectl patch vs bookinfo -n bookinfo --type json -p '[{"op":"replace","path":"/spec/gateways/0", "value":"bookinfo-gateway"}]'
Additional Features
Kiali has many more features than reviewed in this task, such as an integration with Jaeger tracing.
For more details on these additional features, see the Kiali documentation.
For a deeper exploration of Kiali it is recommended to run through the Kiali Tutorial.
Cleanup
If you are not planning any follow-up tasks, remove the Bookinfo sample application and Kiali from your cluster.
To remove the Bookinfo application, refer to the Bookinfo cleanup instructions.
To remove Kiali from a Kubernetes environment:
$ kubectl delete -f https://raw.githubusercontent.com/istio/istio/release-1.30/samples/addons/kiali.yaml